Recommendations of Desegregation Panel Regarding Cluster Reorganization
Public Court Documents
July 12, 1972
7 pages
Cite this item
-
Case Files, Milliken Hardbacks. Recommendations of Desegregation Panel Regarding Cluster Reorganization, 1972. 6d349f8d-53e9-ef11-a730-7c1e5247dfc0. LDF Archives, Thurgood Marshall Institute. https://ldfrecollection.org/archives/archives-search/archives-item/30f6af66-488a-4974-b81b-55719d929d9d/recommendations-of-desegregation-panel-regarding-cluster-reorganization. Accessed July 07, 2026.
Copied!
UNITED STATES DISTRICT COURT
EASTERN DISTRICT OF MICHIGAN
SOUTHERN DIVISION
)
RONALD BRADLEY, et al., )
)
Plaintiffs )
)
v. )
)
WILLIAM G. MILLIKEN, et al. , )
■ )
Defendants )
)
and )
)
DETROIT FEDERATION OF TEACHERS, )
LOCAL 231, AMERICAN FEDERATION )
OF TEACHERS, AFL-CIO, )
)
Defendant- )
Intervenor )
)
and )
)
DENISE MAGDOWSKI, et al., )
• )
Defendants- )
Intervenor )
)
et al. )
__________ 1
CIVIL ACTION NO:
35257
RECOMMENDATIONS OF DESEGREGATION PANEL
REGARDING CLUSTER REORGANIZATION
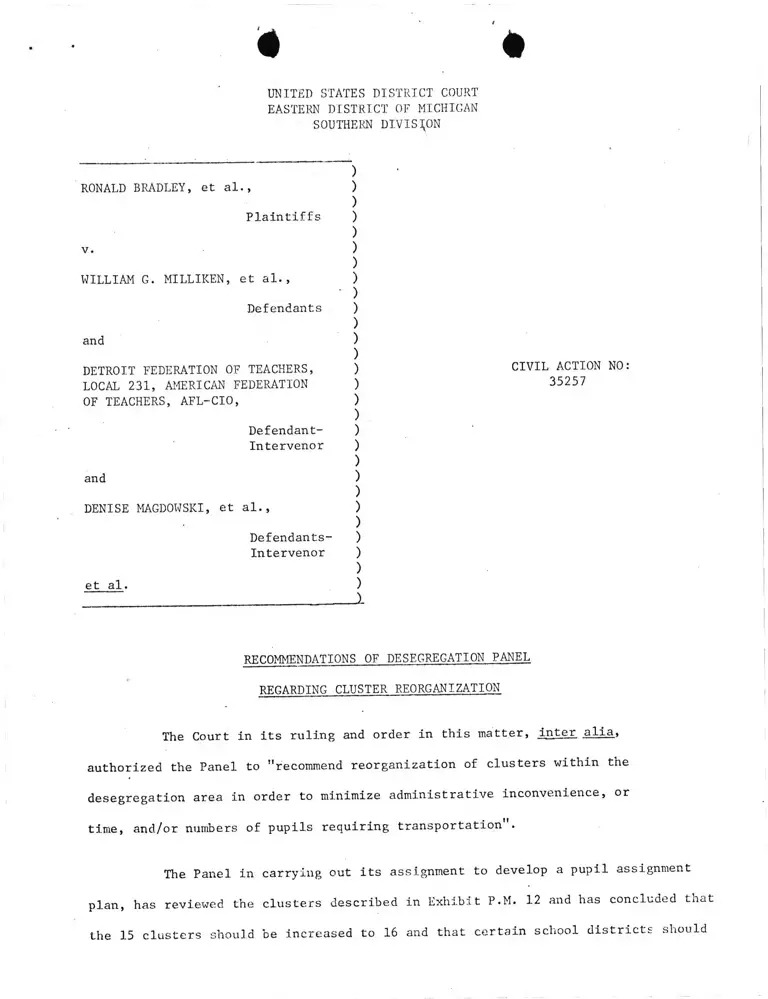
The Court in its ruling and order in this matter, inter aldja*
authorized the Panel to "recommend reorganization of clusters within the
desegregation area in order to minimize administrative inconvenience, or
time, and/or numbers of pupils requiring transportation .
The Panel in carrying out its assignment to develop a pupil assignment
plan, has reviewed the clusters described in Exhibit P.M. 12 and has concluded that
the 15 clusters should be increased to 16 and that certain school districts should
be realigned in the cluster arrangement. These changes are recommended in order
to: (1) attain a racial composition as close as possible to the racial composition
of the desegregation area as a whole; (2)' provide minimum travel time for all
students; and (3) reduce clusters to the smallest size without splitting high
school constellations or suburban districts.
Attached is a revised cluster map dated 10 July 1972 and a description
of the student population of the revised clusters as recommended by the Panel.
An alphabetic identification system is used to distinguish the revised clusters
from plaintiff's plan.
In the opinion of the Panel, recommended revisions offer the following
specific advantages: (1) the range of percentage of black students is reduced
(11 of the 16 clusters fall between 23-28% black, or within 10% of the median
for the area as a whole), (2) the range in cluster size is reduced, and
(3) for some clusters routing and distances are decidedly improved.
Those clusters most significantly improved are:
Cooley to Livonia rather than Farmington
Murray to Melvindale and Lincoln Park rather than Birmingham,
Royal Oak and Hazel Park
Northern to Ferndale, Berkley and Royal Oak rather than Lincoln
Park, Allen Park and Southgate.
The clustering is improved by separation of Kettering from Denby
and Finney and by keeping the Cooley constellation intact.
Both Kettering and Finney have significant numbers of black students
sufficient to function as bases for independent clusters. When com
bined they have 25,000 black students, necessitating a cluster total
in excess of 90,000. The revised plan permits division of these
schools into two clusters.
Cooley and Redford together have 16,000 black students, but when
clustered with Livonia, which is the second largest school system
in the desegregation area, a racial composition of 22.6 percent
results.
Respectfully submitted by the Panel, as listed below in alphabetical
order, this twelfth day of July, 1972.
/Q /(" 'J-Y.l, J-(T- L
Gordon Foster
vJA*: 0 v L i
L . • J /
^ Sy'\-,
Merle Henrickson
s'
Harold Wagner
//>
CLUSTER REVISION RECOMMENDED BY THE PANEL - JUMfclO, 1972f
Lake Shore
i
Wayne-Westland
Dearborn
. V̂̂ Wsstwood
Inkster \ .
| M ri l M -“ Dearborn^f/.slvindai , _ liver Houge
o /
pork /L in co ln / Ecorso
Park | v
t t
Panel Recommendation for Revised Clustering Plan
Black
Total Enrollment Enrol lment Percent
Lake Shore 9 ,62 1 48 . 5
Roseville 14 ,734 213 1 . 4
East Detroit 12 ,831 6 • 1
Southeastern 15 ,4 18 12, 708 82. 4
52 ,604 12.-975 24. 7
South Lake 5, 306 0 .0
G rosse Pointe 13 ,323 1 . o
Lakeview 7, 751 0 . 0
King 9 ,80 2 9, 496 9 6 .9
3 6 ,1 8 2 9, 497 26. 2
Centerline 6, 865 3 .0
Fitzgerald 5, 374 0 . 0
W arren Woods 8, 958 0 . 0
Northeastern 10 ,286 9, 130 88. 8
3 1 ,4 8 3 9, 133 29. 0
F ra.se r 7, 304 1 . 0
Harper Woads 1 ,981 0 . 0
Denby
Fxmiey
10 ,906
15 ,093
560
8, 549
5. 1
56, 6
3 5 ,2 84 9, n o 25. 8
Van Dyke 7, 192 . 2 .0
W arren 2 9 ,9 9 5 52 • 2
Osborn 11 ,9 6 2 2, 730 2 2 ,8
Kettering 17 ,966 16 ,749 9 3 .2
6 7 , 1 1 5 19 ,533 29. 1
Hazel P ark 7 ,9 8 5 0 .0
Hamtramck 3 ,0 4 4 90 5 2 9 .7
Lamphere 5 ,878 0 • 0
nMadison Heights 4, 708 L,
Troy
Pershing
5, 958
14 ,6 72
0
10 ,0 03
•0
68 ,2
4 2 ,242 10, 915 25. 8
• I
Panel Recommendation for Revised Clustering Plan
Total Enrollment
F erndale
Berkley-
Highland P ark
Royal Oak
Clawson
Northern
8, 376
8, 404
7, 837
19, 267
4, 996
8, 929
57, 809
Birmingham
Oak P ark
Southfield
Central
17, 520
5, 867
16 ,346
12 ,746
52,479
Bloomfield Hills
Farmington
Clarencevii le
West Bloomfield
Ford
Mumford
9 ,4 3 8
16 ,339
3 ,9 1 8
4, 772
10, 705
12, 115
57 ,287
Livonia
Cooley
Redford
38, 105
19 ,2 00
15, 534
72 ,839
Garden City
South Redford
N. Dearborn Heights
Crestwood
C h e rry Hill
Redford Union
Cody
Mackenzie
13, 853
7, 883
2, 765
' 5, 282
5, 127
9 ,6 7 7
16 ,056
20, 745
Black
rollment Percent
799 9 .5
8 . 1
6, 158 78. 6
3 .0
0 .0
8, 877 9 9 .4
15, 845 2 7 .4
5 .0
590 10. 1
5 .0
12 ,702 99. 7
13 ,302 25. 3
35 .4
9 . 1
0 .0
0 .0
3 ,3 1 4 3 1 .0
11 , 540 95. 3
14 ,8 98 2 6 .0
8 .0
15, 771 82. 1
683 4. 4
16 ,4 62 2 2 .6
0 .0
0 .0
0 . 0
0 .0
15 .3
2 .0
2 ,4 2 5 15. 1
20, 192 9 7 .3
81, 388 2 2 ,6 1 7 27. 8
I I
Panel Recommendation fo r Revised Clustering Plan
Black
Total Enrollment Enrollment P ercent
Taylor 20, 004 303 1. 5
Dcarbo rn 21, 634 2 . 0
Dearborn Heights 5, 626 0 , 0
Fair lane 1, 138 0 . o
Romulus 5, 450 961 17. 6
Northwestern 14, 308 14 ,2 6 5 9 9 .7
‘ 6 8 ,2 1 0 15, 531 22. 8
Inkster 4, 624 3,9-62 85. 7
W ayne 22, 514 21 , 1
Westwood 5, 120 1, 842 3 6 .0
Chadsey 5, 975 2, 053 34, 4
38, 233 7, 878 2 0 .6
Ecorse 4, 341 2 ,2 6 8 52 .2
Allen Park 6, 522 5 • 1
Southgate 5, 613 0 • 0
Western 11, 314 4, 964 43. 9
27, 790 7, 237 26. 0
River Rouge 3, 858 1 ,72 3 4 4 .7
Riverview 3 ,66 5 0 * o
Wyandotte
Southwestern
8, 403
1 1 , 0 2 8
0
4, 826
. 0
4 3 .9
2 6 ,9 54 6, 559 2 4 .3
Lincoln P ark 12, 217 6 .0
Melvindale 5, 574 0 . 0
M urray 8, 268 6-, 359 76 .9
2 6 ,0 5 9 6, 365 2 4 .4
t
July 10, 1972