Defendants' Brief in Opposition to Motion for Preliminary Injunction with Certificate of Service, Affidavits Filed by Defendants Relating to Summary Judgment and Preliminary Injunction Proceedings, and Additional Affidavits Filed by Defendants Relating to Preliminary Injunction Proceedings
Public Court Documents
March 20, 1998
227 pages
Cite this item
-
Case Files, Cromartie Hardbacks. Defendants' Brief in Opposition to Motion for Preliminary Injunction with Certificate of Service, Affidavits Filed by Defendants Relating to Summary Judgment and Preliminary Injunction Proceedings, and Additional Affidavits Filed by Defendants Relating to Preliminary Injunction Proceedings, 1998. e4d2b22c-d90e-f011-9989-7c1e5267c7b6. LDF Archives, Thurgood Marshall Institute. https://ldfrecollection.org/archives/archives-search/archives-item/c61bea79-024f-4cae-870a-840adbc863fc/defendants-brief-in-opposition-to-motion-for-preliminary-injunction-with-certificate-of-service-affidavits-filed-by-defendants-relating-to-summary-judgment-and-preliminary-injunction-proceedings-and-additional-affidavits-filed-by-defendants. Accessed July 06, 2026.
Copied!
UNITED STATES DISTRICT COURT
EASTERN DISTRICT OF NORTH CAROLINA
EASTERN DIVISION
Civil Action No. 4-96-CV-104-BO(3)
MARTIN CROMARTIE, THOMAS )
CHANDLER MUSE, and GLENNES )
DODGE WEEKS,
Plaintiffs,
v.
JAMES B. HUNT, JR., in his official
capacity as Governor of the State of North
Carolina, et al.,
Defendants.
N
r
”
N
t
?
S
e
w
?
N
a
?
N
w
N
w
Na
tt
’
S
u
Su
nt
!
a
t
?
u
w
’
DEFENDANTS’ BRIEF IN OPPOSITION TO
MOTION FOR PRELIMINARY INJUNCTION
INTRODUCTION
The plaintiffs come to this Court seeking the extraordinary relief of a preliminary injunction
to prevent the State of North Carolina from going forward with its scheduled congressional elections,
an election process which has already begun. At issue in this case is North Carolina’s freedom to
make its own redistricting decisions and exercise its discretion in devising a substitute for the prior
Congressional plan found to be unconstitutionalin Shaw v. Hunt, 517 U.S. 899, 116 S. Ct. 1894, 135
L. Ed. 2d 207 (1996). Plaintiffs contend that the remedial Congressional plan enacted in 1997 is the
tainted “fruit of the poisonous tree,” and is itself an unconstitutional racial gerrymander. Defendants
have demonstrated by affidavits and the legislative history filed in support of their motion for
summary judgment that the General Assembly properly exercised its discretion in performing the
legislative task of correcting the constitutional violation, and further, that race was not the
predominate factor motivating the legislature’s redistricting decisions.
Enjoining an election which has already begun is an extraordinary remedy that would deny
the voters of North Carolina the opportunity to elect members of Congress in a meaningful and
orderly manner and would frustrate the public interest. An injunction stopping an ongoing
congressional election process “is serious business.” Oden v. Brittain, 396 U.S. 1210, 90 S. Ct. 4,
24 L. Ed. 2d 32 (1969) (Black, J., opinion in chambers). Plaintiffs’ contentions cannot withstand
defendants’ motion for summary judgment, and the State of North Carolina and its voters must be
allowed to proceed to elect their twelve members of Congress. For the reasons discussed herein and
in defendants’ brief in support of their motion for summary judgment, defendants urge the Court to
deny plaintiffs’ request for preliminary injunction and to grant summary judgment dismissing
plaintiffs’ action altogether.
In addition to the affidavits and materials filed in support of their motion for summary
judgment, defendants also rely on the following affidavits filed contemporaneously with this brief:
Congressman Walter B. Jones Congressman Bob Etheridge
Congresswoman Sue Myrick Congressman David E. Price
Congressman Charles H. Taylor Gary O. Bartlett, Executive Secretary-Director
of the N.C. State Board of Elections
Congresswoman Eva M. Clayton (Second Affidavit)
On March 2, 1998, defendants filed the Affidavits of Senator Roy Cooper, III,
Representative Edwin McMahan, Dr. David R. Goldfield, Dr. David W. Peterson, Dr. Alfred W.
Stuart, Dr. Gerald R. Webster, and Gary O. Bartlett (hereinafter © Aff.”).
2
STATEMENT OF FACTS
Following the July 9, 1996, remand for remedial proceedings in Shaw, plaintiffs Martin
Cromartie, Thomas Chandler Muse and Glennes Dodge Weeks filed their original action challenging
Congressional District 1. On that same day, Mr. Cromartie, Mr. Muse and Ms. Weeks also moved
to amend the complaint in Shaw to be added as plaintiffs for the remedial phase, a motion which was
allowed. A stay was entered in this action pending completion of the remedial phase in Shaw.
The Shaw Court on August 8, 1996, enjoined North Carolina from using the 1992 plan after
the 1996 election and directed the General Assembly to submit a new plan for the Court’s approval
by April 1, 1997. On August 21, 1996, the U.S. Supreme Court rejected plaintiffs’ efforts to
overturn that order. On March 31, 1997, a new congressional redistricting plan was enacted
(hereinafter “1997 plan”) and submitted to the Shaw Court for approval. After preclearance by the
United States Department of Justice, plaintiffs, including Cromartie, Muse and Weeks, were offered
the opportunity to present any opposition to the plan. They elected not to challenge the
constitutionality of the remedial plan. On September 12, 1997, the Shaw Court ordered the new plan
“APPROVED as having adequately remedied the specific constitutional violation respecting former
congressional District 12.” No appeal was filed from that order.
On October 17, 1997, the stay in this case was dissolved and plaintiffs filed their amended
complaint challenging Districts 1 and 12 and the State’s newly approved congressional plan as an
unconstitutional racial gerrymander. Although the candidate filing period for the United States
House of Representatives opened at noon on January 5, 1998, and closed at noon on February 2,
1998, plaintiffs delayed until January 30, 1998, the Friday on the eve of the close of the candidate
~
0
filing period, to file a motion for preliminary injunction; not until February 23, 1998, did plaintiffs
file a brief in support of their preliminary injunction motion.
While plaintiffs tarried, the election process began. Thirty-one candidates filed notice of
candidacy and contested primaries will be held in eight of the State’s twelve congressional districts.
County boards of elections have updated their records assigning voters to their districts and have
notified voters of their districts; voter lists have been made available to candidates. Ballots have
been designed, printed and distributed, and voting began March 16, 1998, the first day of absentee
voting. Publication in local newspapers of the first notice of the primary elections and the
registration deadline was completed March 21, 1998. The last day to register to void for the primary
is April 10, 1998. The primaries will take place May 5, 1998, along with primaries for other state,
federal and local offices. Millions of dollars have already been raised and spent by congressional
candidates.? Much time and effort has already been expended by candidates organizing their
campaigns and familiarizing themselves with the voters in the newly configured districts. The
candidates have been campaigning to provide the voters with their views on issues of concern to
each district’s citizens. Citizens and community leaders have already informed themselves about
their districts and the candidates in their districts, and many are actively involved in the candidates’
campaigns.’ Plaintiffs’ motion for preliminary injunction comes far too late and should be denied
i
in this case where the “election machinery is already in progress” and “an impending election is
Eo)
2 See Second Affidavit of Gary O. Bartlett, Executive Secretary-Director of the North
Carolina State Board of Elections (hereinafter “Second Bartlett Aff.”), filed March 20, 1998.
3 See Affidavits of Congresspersons Walter B. Jones, Sue Myrick, Charles H. Taylor,
Eva M. Clayton, Bob Etheridge and David E. Price (hereinafter Aff.”), filed March 20, 1998.
4
imminent.” Reynolds v. Sims, 377 U.S. 533, 585, 84 S. Ct. 1362, 1394, 12 L. Ed. 2d 506, 541
(1964).
ARGUMENT
I. THE STANDARD FOR EVALUATING PLAINTIFFS’ REQUEST FOR
PRELIMINARY INJUNCTIVE RELIEF.
“Federal decisions have uniformly characterized the grant of interim relief as an
extraordinary remedy involving the exercise of a very far-reaching power, which is to be applied
‘only in [the] limited circumstances’ which clearly demand it.” Direx Israel, Ltd. v. Breakthrough
Med. Corp., 952 F.2d 802, 811 (4th Cir. 1991). Because it “is an extraordinary remedy, the right
to relief must be clear and unequivocal” to justify issuance of a preliminary injunction. SCFC ILC,
Inc. v. Visa USA, Inc., 936 F.2d 1096, 1098 (10th Cir. 1991) (citation omitted); see also Federal
Leasing, Inc. v. Underwritersat Lloyd's, 650 F.2d 495,499 (4th Cir. 1981) (“award of a preliminary
injunction is an extraordinary remedy, to be granted only if the moving party clearly establishes
entitlement to the relief sought”).
Plaintiffs in their motion and supporting brief fail even to acknowledge the extraordinary and
drastic nature of the preliminary injunction they seek. They utterly ignore the “even heavier burden”
imposed on a movant seeking any of three types of “disfavored” preliminary injunctions:
(1a preliminary injunction that disturbs the status quo; (2) a preliminary injunction
that 1s mandatory as opposed to prohibitory; and (3) a preliminary injunction that
affords the movant substantially all the relief he may recover at the conclusion of a
full trial on the merits.
SCFC ILC, 936 F.2d at 1098-99. Here, the injunction sought by plaintiffs falls into two of the three
disfavored categories because it would disrupt the status quo and would grant plaintiffs the relief
sought prior to a decision on the merits.
“The foundational principle for preliminary relief is that ‘it is a sound idea to maintain the
status quo ante litem, provided that it can be done without imposing too excessive an interim burden
upon the defendant.” Feller v. Brock, 802 F.2d 722, 727 (4th Cir. 1986) (quoting Blackwelder
Furniture Co. v. Seilig Mfg. Co., 550 F.2d 189, 195 (4th Cir. 1977). Indeed, it has been said that the
very purpose of a preliminary injunction is to maintain the status quo until the case can be resolved
on the merits. See Wetzel v. Edwards, 635 F.2d 283, 286 (4th Cir. 1980); Morgan v. Fletcher, 518
F.2d 236, 239 (5th Cir. 1975). That status quo, “the last uncontested status between the parties
which preceded the controversy until the outcome of the final hearing,” Stemple v. Board of Educ.
of Prince George's County, 623 F.2d 893, 898 (4th Cir. 1980), will not be preserved in this case if
the Court undertakes to upset it by granting plaintiffs’ motion to enjoin the election. Instead of
maintaining the status quo, a preliminary injunction in this case disrupts it by compelling the State
to abandon an election in progress.
In addition, the burden on a “party seeking a preliminary injunction is especially heavy when
the relief sought would in effect grant plaintiff a substantial part of the relief it would obtain after
a trial on the merits.” GTE Corp. v. Williams, 731 F.2d 676, 679 (10th Cir. 1984). The injunctive
relief sought by plaintiffs would grant them the ultimate relief they seek, at least for the 1998
elections. This procedure “is similar to the ‘Sentence first -- Verdict Afterwards’ type of procedure
parodied in Alice in Wonderland, which is an anathema to our system of jurisprudence.” SCFC ILC,
936 F.2d at 1099.
This Court must balance four factors in determining whether the exercise of the “far-reaching
power of a preliminary injunction” is “clearly demanded:” (1) the irreparable harm to the plaintiffs
if the relief is denied; (2) the harm to the defendants if the relief is granted; (3) the likelihood of
6
plaintiffs’ success on the merits; and (4) the public interest. Blackwelder Furniture Co., 550 F.2d
189 (4th Cir. 1977); Rum Creek Coal Sales, Inc. v. Caperton, 926 F.2d 353 (4th Cir. 1991).
Plaintiffs seeking preliminary relief bear “the burden of establishing that each of these factors
supports granting the injunction.” Direx Israel, 952 F.2d at 812. A sequential process is followed
in determining whether the plaintiffs have carried this burden. The first step is to determine whether
plaintiffs have “made a ‘clear showing’ of irreparable injury absent preliminary injunctive relief.”
Direx Israel, 952 F.2d at 812. The next step is to balance any irreparable injury the plaintiffs have
proved against harm to defendants. If the plaintiffs have proved that “the balance of hardship tips
decidedly” in their favor, they must go on to prove “that the dispute presents a serious issue for
litigation and that the injunction will serve the public interest.” Merrill Lynch, Pierce, Fenner &
Smith, Inc. v. Bradley, 756 F.2d 1048, 1054-55 (4th Cir. 1985) (emphasis added). “As the balance
[of harm] tips away from the plaintiffs], a stronger showing on the merits is required.” Direx Israel.
952 F.2d at 313.
This well-established standard has been applied in weighing requests to preliminarily enjoin
elections. See, e.g., Republican Party of Va. v. Wilder, 774 F. Supp. 400 (W.D. Va. 1991) (three-
judge court) (applying the foregoing factors in denying injunction against Virginia legislative
elections). Application of these standards to this case demonstrates that the plaintiffs are not entitled
to the injunction they request.
IL. PLAINTIFFS HAVE NOT MADE A CLEAR SHOWING OF IRREPARABLE HARM
IF AN INJUNCTION IS NOT ISSUED.
Proof of irreparable injury “is the single most important prerequisite for the issuance of a
preliminary injunction.” Citibank, N.A. v. Citytrust, 756 F.2d 273, 275 (2nd Cir. 1985) (citing 11
CHARLES ALAN WRIGHT & ARTHUR R. MILLER, FEDERAL PRACTICE AND PROCEDURE § 2948 at 431
(1993)). See also Sampson v. Murray, 415 U.S. 61, 88.94 S. Ct. 937,951-52,39 L. Ed. 2d 166, 185
(1974), quoted in Direx Israel, 952 F.2d at 812 (“*[t]he basis of injunctive relief in the federal courts
has always been irreparable harm and inadequacy of legal remedies”). “Moreover, the required
irreparable harm must be neither remote nor speculative, but actual and imminent.” Direx Israel,
952 F.2d at 812 (internal quotes and citations omitted). See also Dan River, Inc. v. Icahn, 701 F.2d
278.284 (4th Cir. 1983) (preliminary injunction denied because of absence of proof of immediate
irreparable harm). Plaintiffs in this case have failed to meet their burden of making a clear showing
of irreparable harm absent the entry of a preliminary injunction.
The plaintiffs argue two possible types of harm which they contend support entry of a
preliminary injunction enjoining the impending election: representationalharm and stigmatic harm.
Neither of the harms is irreparable and both presuppose that plaintiffs will win on the merits of their
claim. In suggesting representational harm, plaintiffs rely on the Court’s concern in Shaw that when
a district is racially gerrymandered “elected officials are more likely to believe that their primary
obligation is to represent only members of that group, rather than their constituency as a whole.”
Shaw v. Reno, 509 U.S. 630, 648, 113 S. Ct. 2816,2827, 125 L. Ed. 2d 511, 529 (1993). Plaintiffs
do not present any concrete examples of representational harm they personally have suffered; instead
they make the conclusory allegation: “Plaintiffs and all other North Carolina voters - black and
white - have already been suffering this ‘representational’ harm since November 1992.” See
Plaintiffs’ Brief in Support of Motion for Preliminary Injunction at 6. The fallacy of this theory of
harm is that the constitutional violation in the 1992 plan already has been remedied and further
elections under the unconstitutional plan enjoined.
8
The election underway now is under the new 1997 plan and plaintiffs can show potential
representational harm only if they win on the merits by proving an unconstitutional racial
gerrymander. The 1997 plan, however, was the result of a bipartisan agreement first, to cure the
constitutional defects in the 1992 plan by assuring that race was not the predominate factor to which
traditional criteria were subordinated; and second, to maintain the existing partisan balance of six
Republicans and six Democrats in the State’s congressional delegation.® In achieving these goals,
the 1997 plan substantially altered the shapes and make-ups of the districts. The district lines respect
precinct boundaries and “cross-overs” and single points of contiguity were not used to connect
population groups.’ Almost 35% of the geographic area and almost 33% of the population of
District 1 were shifted into other districts; similarly, over 58% of the geographic area and almost
32% of the population of District 12 were assigned to different districts.® The travel times and
distances for District 12 improved dramatically (it now has the third shortest travel time of 1.67
hours and covers a distance of 95 miles), while District 1 improved substantially (the travel time is
now three hours or less and the distance extends 150 miles or less, depending on the route).’
District 1 is now a bare African-American majority in total population (50.27%), although it is
majority white in voting age population and voter registration; District 12 is no longer an African-
American majority district.®
$ See Cooper Aff. 91 3, 5 and 7-9; McMahan Aff. § 3, 5-7 and 9-10.
5 See Cooper Aff. § 7.
$ See Webster Aff., Rpt. pp. 24-25, and Tbls. 7 & 8.
? See Stuart Aff. 99 8 and 10-11, and This. 1 & 2.
! See Bartlett Aff., Vol. 1 at 97C-27A-2, p. 25.
9
Plaintiffs’ theoretical claim of representational harm lacks any evidentiary support. By
contrast, Congresswoman Eva Clayton necessarily is aware that she represents “the entire First
District, not just the minority voters in the district.” She is responsive to the shared needs and
concerns of this rural and economically poor region, needs and concerns which “transcend race.”
Under the circumstances of this case, plaintiffs will be hard-pressed not only to establish the merits
of their claim, but also to prove an actual or imminent prospect of representational harm.
The other harm proffered by plaintiffs, that of stigmatization or racial stereotyping, suffers
the same flaws. In addition to the integrated demographics of the challenged districts, other
circumstances contradict any suggestion of offensive and demeaning racial stereotyping. Plaintiffs
concede that the location of District 1 in the northeastern Coastal Plain has historical and
demographic legitimacy.” Demeaning racial stereotyping is certainly not present in District 12. It
is a distinctly urban district in which white citizens constitute a majority.
Finally, even accepting plaintiffs’ alleged harm at face value, a separate independent reason
why the plaintiffs’ request for injunctive relief must fail is that the harm alleged by plaintiffs is not
irreparable as a matter of law. The Court has full remedial powers to fashion relief if, after hearing
all the evidence in the case, it concludes that the current redistricting plan violates the constitution.
In appropriate circumstances, relief may even be given by means of special elections, Ketchum v.
City Council of Chicago, Ill., 630 F. Supp. 551, 565 (N.D. Ill. 1985) (“Federal courts have often
: See Clayton Aff. q 13.
2 See Mortimer Aff. p. 9.
10
ordered special elections.”), or by deferring relief to the next election cycle. Republican Party of
Va., 774 F. Supp. at 407.
The lack of irreparable harm is an insurmountable barrier to plaintiffs’ claim for preliminary
injunctive relief. Alleged harm which can be repaired in the future is simply not irreparable harm.
As the Fifth Circuit recently observed in reversing a district court’s preliminary injunction against
elections for the Louisiana Supreme Court:
We are cognizant, however, that “‘[t]he possibility that . . . other corrective relief will
be available at a later date, in the ordinary course of litigation, weighs heavily against
a claim of irreparable harm.’” Sampson v. Murray, 415 U.S. 61, 70, 94 S. Ct. 937,
943,39 L. Ed. 2d 166 (1974) (quoting Virginia Petroleum Jobbers Assn. v. FPC, 104
U.S. App. D.C. 106, 110, 259 F.2d 921, 925 (1958)). In this we agree with the
commentators who suggest that “[o]nly when the threatened harm would impair the
court’s ability to grant an effective remedy is there really a need for preliminary
relief.” Wright & Miller, Federal Practice and Procedure § 2948 at 431-34 (1973).
Chisom v. Roemer, 853 F.2d 1186, 1189 (5th Cir. 1988).
Harm is only irreparable when it cannot be redressed by a legal or an equitable remedy
following a trial. See e.g. Weinberger v. Romero-Barcelo, 456 U.S.305,312,102 S. Ct. 1798, 1803,
72 L. Ed. 2d 91, 98 (1982) (“The Court has repeatedly held that the basis for injunctive relief in the
federal courts has always been irreparable injury and the inadequacy of legal remedies.”) See also
Goosby v. Town of Hempstead, 981 F. Supp. 751, 763 (E.D.N.Y. 1997) (preliminary injunction to
stop election denied because any injury plaintiff would suffer could be remedied after trial). The
Court should refuse to enjoin the election in progress on the grounds that the plaintiffs have failed
to show they will suffer irreparable injury if the injunction does not issue.
11
III. STOPPING THE CONGRESSIONAL ELECTIONS PROCESS WOULD CAUSE
SUBSTANTIAL AND IRREPARABLE HARM TO THE PUBLIC AND
DEFENDANTS.
Plaintiffs unpersuasively argue that no harm can result to the defendants and the public if
their motion is granted.!" Remarkably, plaintiffs never discuss the inevitable, irreparable and
deleterious consequences of awarding them the relief they seek. Plaintiffs contend that the
extraordinary remedy of enjoining the ongoing congressional election is appropriate for the purpose
of putting candidates “on notice” to minimize their campaigning and to “alert” the General Assembly
to the need to prepare “a contingency redistricting plan to be put into effect in the event that the
preliminary injunction was made permanent.” See Plaintiffs’ Brief in Support of Motion for
Preliminary Injunction at 7-8. This indeed would be an extraordinary use of the Court’s injunctive
powers. Plaintiffs have delayed far too long. Voting has begun, campaigning is in full swing and
campaign contributions have been made and spent. Both the defendants and the public interest will
be irreparably harmed if the Court does not deny the motion for preliminary injunction and allow
the election process to move forward. In an election context, the defendants’ interest in proceeding
with elections is inextricably linked to the public interest in going forward. “The election has been
scheduled as required by state law and any election is, without question, in the public interest.”
LeBlanc-Sternberg v. Fletcher, 763 F. Supp. 1246, 1249 (S.D.N.Y. 1991).
H In the elections context, the harm to defendants and the public are inextricably
intertwined and thus will be reviewed together. See LeBlanc-Steinberg v. Fletcher, 763 F. Supp.
1246, 1249 (S.D.N.Y. 1991).
12
A. UNWARRANTED DELAY BY PLAINTIFFS.
Plaintiffs have sat on their rights to the detriment of the citizens of North Carolina. They
filed their first complaint in this case over eighteen months ago and declined to participate in the
remedial proceedings in Shaw when the 1997 plan was approved as an adequate remedy of the
constitutional violation, even though they had joined that case as plaintiffs. They filed their
amended complaint in this case on October 17, 1997, with a prayer for both a temporary restraining
order and preliminary injunction to enjoin preparations for primary or general elections. However,
they delayed thereafter for three and one-half months, until January 30, 1998, on the eve of the
closing of the candidate filing period, before filing an unsupported motion for preliminary
injunction. They finally filed a brief in support of their motion for preliminary injunction on
February 23, 1998.
In cases involving allegedly unconstitutional apportionment, courts are to fashion relief
according to the “well-known principles of equity.” Reynolds, 377 U.S. at 585, 84 S. Ct. at 1394,
12 L. Ed. 2d at 544. This equitable doctrine is supported by sound principles of judicial and public
policy that operate independently of the merits of plaintiffs’ claims, recognizing that an unexcused
delay in prosecuting a claim, whether through simple neglect or intentional abuse of process, can
prejudice the rights not only of specific defendants but, of those unnamed who would be affected
by tardy adjudication of the claim. In the present case, such prejudice would reach all voting citizens
of North Carolina and candidates for the 1998 congressional elections.
The failure to exercise an enforceable right for an unreasonable amount of time may bar both
equitable and legal relief. Goshen Road Environmental Action v. United States Dept. of Agriculture,
891 F. Supp. 1126, 1132 (E.D.N.C. 1995), aff'd 103 F.3d 117 (4th Cir. 1996). When a party seeks
13
injunctive relief, unexplained delay standing alone may justify denial of a preliminary injunction.
Tough Traveler, Ltd. v. Outbound Products, 60 F.3d 964, 968 (2nd Cir. 1993); Majorica, S.A. v. R.H.
Macy & Co., 762 F.2d 7, 8 (2nd Cir. 1985). In such cases, plaintiffs’ argument of irreparable injury
is negated by their delay in moving for a preliminary injunction. Tough Traveler, 60 F.3d at 968
(presumption of irreparable harm is inoperative if plaintiff has delayed in moving for preliminary
injunctive relief); Citibank, N.A., 756 F.2d at 276 (“delay may not rise to the level of laches and
thereby bar a permanent injunction,” but still indicates an absence “of irreparable harm required to
support a preliminary injunction”); Majorica, S.A., 762 F.2d at 8 (lack of diligence may preclude
preliminary injunction because it goes to issue of irreparable harm).
Plaintiffs’ challenge to the 1997 Congressional plan could have been resolved on the merits
during the months that have elapsed since the complaint was amended in October, 1997. Under
these circumstances, denial of preliminary injunctive relief is justified since the “potential harm was
a product of [plaintiffs’Jown delay.” Quince Orchard Valley Citizens Ass 'n., Inc. v. Hodel, 872 F.2d
75, 79 (4th Cir. 1989). In Quince Orchard Valley, the court cautioned that equity demands those
who would challenge “time sensitive” public matters should do so with “haste and dispatch.” 7d.
at 80. See also Skehan v. Board of Trustees of Bloomsburg State College, 353 F. Supp. 542, 543
(M.D. Pa. 1973) (“Since an application for preliminary injunction is based upon an urgent need for
the protection of Plaintiffs’ rights, a long delay in seeking relief indicates speedy action is not
required.”).
There is no explanation that can excuse plaintiffs’ procrastinationin this case at the expense
of the voting public. Inexcusable or unreasonable delay in challenging a voting plan occurs after
“the plaintiff discovers or with reasonable diligence could have discovered” the facts giving rise to
14
the litigation. White v. Daniel, 909 F.2d 99, 102 (4th Cir. 1990). A delay of as little as a few
months can be inexcusable. See Citizens for the Scenic Severn River Bridge, Inc. v. Skinner, 802 F.
Supp. 1325, 1342 (D. Md. 1991), aff'd, 972 F.2d 338 (4th Cir. 1992) (delay of approximately ten
months); Libertarian Party v. Davis, 601 F. Supp. 522, 525 (E.D. Ky. 1985) (delay of three months
from constructive knowledge and one and one-half months from actual knowledge); Dobson v.
Mayor & City Council of Baltimore City, 330 F. Supp. 1290, 1301-02 (D. Md. 1971) (delay of three
and one-half months). With the election process set to begin, plaintiffs’ lack of diligence in moving
for a preliminary injunction is inexcusable and unreasonable. It is well established that any claim
against a state electoral procedure must be expressed expeditiously. E.g., Williams v. Rhodes, 393
U.S. 23, 34-35, 89 S. Ct. 5,12, 21 L. Ed. 2d 24, 33-34 (1968); Fulani v. Hogsett, 917 F.2d 1028,
1031 (7th Cir. 1990). The dalliance by plaintiffs in such an important matter is unexplained and
inexplicable; they are entitled to no relief in equity.
In two election cases indistinguishable from the facts of the case at bar, a motion for
preliminary injunction to halt an election was denied on the equitable grounds of laches. In one case,
relief was denied where plaintiffs filed suit two and one-half months prior to the election, but did not
seek an injunction until three weeks prior to the election. McNeil v. Springfield Park Dist., 656 F.
Supp. 1200 (C.D. 111. 1987). In McNeil, the court specifically noted that candidates had commenced
campaigning in earnest and had expended both time and money in their election efforts; furthermore,
the election machinery had been placed in motion and absentee balloting had begun. Id. at 1201-2,
1203. Plaintiffs’ failure to seek an injunction until immediately prior to the election when the facts
giving rise to the cause of action were known at the time the suit was filed, was “inexcusable delay.”
Id. at 1203. Similarly, the district court in Knox v. Milwaukee County Bd. of Elections Comm rs,
13
581 F. Supp. 399 (E.D. Wis. 1984), held that an attempt to enjoin an upcoming primary was barred
by laches when the suit and injunction request were filed only seven weeks prior to the election. In
Knox, the court found that an injunction “would have a devasting impact on the electoral process”
since the campaign had been underway for nearly two months.
In this regard candidates’ election reports have been filed, campaign committees
organized, contributions solicited, and literature distributed. In addition, the
Milwaukee County Board of Election Commissioners has itself prepared absentee
ballots, distributed informational publications and notices, and undertaken to comply
with the myriad of other election requirements prescribed by state law. An order
enjoining the elections at this late date would thus result in considerable prejudice to
the defendants, the candidates, and the electorate itself.
Id. at 405.
Substantial prejudice is apparent here, where the election machinery is in progress and votes
are being cast. The primary election is only six weeks away. In determining whether prejudice
exists, courts “assume that considerable voter confusion would result when citizens [find] themselves
no longer in the same [congressional] district, and likely faced with choosing from unfamiliar
candidates for [congressional]seats.” Simkins v. Gressette, 495 F. Supp. 1075, 1081 (D.S.C.), aff d,
631 F.2d 287 (4th Cir. 1980). Here, the assumption is fully justified. Candidates have filed and are
actively campaigning; ballots have been prepared and voting has begun. Citizens, candidates and
election administratorshave settled expectations regarding the boundaries of the challenged districts.
The voters of North Carolina have a clear interest in knowing in which districts they reside and in
having an adequate opportunity to consider the qualification of candidates seeking to represent
particular districts in the imminent elections. '?
i See generally, Second Bartlett Aff; Jones Aff.; Myrick Aff; Taylor Aff; Clayton
Aff; Etheridge Aff; and Price Aff.
16
Defendants cannot conceive of, and plaintiffs have not proposed, a rational plan if the
ongoing election is enjoined that would not significantly prejudice North Carolina voters as well as
crucial public policies preserved through the existing election timetables. The present case offers
a “classic instance” exemplifying the wisdom of equitable forbearance. See, e.g., Simkins, 631 F.2d
at 295-96 (citing “enormous disruption” to voters, candidates, and electoral process from plaintiffs’
delay in petitioning for reapportionment); Fulani, 917 F.2d at 1031 (*As time passes, the state’s
interest in proceeding with the election increases in importance as resources are committed and
irrevocable decisions are made.”). The harm to the public and the defendants if the ongoing election
is enjoined is palpable, and results entirely from plaintiffs’ delay in seeking relief. Equity demands
that plaintiffs’ request be denied.
B. Low VOTER TURNOUT.
The public interest dictates that the congressional primaries be held at the same time as
primary elections for other offices. “Otherwise, low voter turnout might well occur.” Republican
Party of Va., 774 F. Supp. at 407. Low voter turnout is a critical factor causing courts to be very
reluctant to require that elections be postponed and held separately from other scheduled elections.
See, e.g., Watkins v. Mabus, 771 F. Supp. 789, 801 (S.D. Miss. 1991) (three-judge court), aff'd in
part, vacated in part, 502 U.S.954,112S. Ct. 412,116 L. Ed. 2d 433 (1991) (vacated only as to part
of appeal relating to § 5 of the Voting Rights Act, on grounds of mootness); Campos v. City of
Houston, 776 F. Supp. 304, 308 (S.D. Tex. 1991); Cosner v. Dalton, 522 F. Supp. 350, 363-64 (E.D.
Va. 1981). Past experience in North Carolina demonstrates that a separate primary election for the
17
congressional races in North Carolina will produce a substantially reduced turnout.” Postponing the
congressional primary and holding it separately would cause such a depressed turnout as to deprive
the voters and citizens of this State of a meaningful process for selecting congressional candidates.
The Court’s “overriding concern” should be “to avoid a disruption of the electoral process, an event
which would materially adversely affect racial . . . minorities.” Terrazas v. Clements, 537 F. Supp.
514, 546-47 (N.D. Tex. 1982) (three-judge court).
C. DISRUPTION OF ELECTION PROCESS, COSTS AND ADMINISTRATIVE BURDENS.
The election machinery and its administration is a multi-phased and lengthy process from
the time the candidate filing period opens until the election itself. The recognized harm to the public
in enjoining an election already begun clearly weighs against the entry of a preliminary injunction
halting North Carolina’s congressional elections.
In considering injunctive relief, the Court must keep in mind what would be required if
elections under the 1997 plan are enjoined. This Court may not simply adopt a new plan, but would
be required to give the General Assembly the first opportunity to draft a new plan, see McDaniel v.
Mehfoud, 702 F. Supp. 588, 596 (E.D. Va. 1988); Cosner, 522 F. Supp. at 364, and the plan would
have to be precleared by the U.S. Department of Justice before it could be implemented. See
McDaniel v. Sanchez, 452 U.S. 130, 153, 101 S. Ct. 2224, 2228, 68 L. Ed. 2d 724, 742-43 (1981).
No viable means of adopting a new plan and conducting orderly congressional elections
exists. Even putting an interim court-ordered plan into effect at this late date would be no quick and
easy task. It would require input from the parties and the public, and development of criteria to be
i See Second Bartlett Aff. § 11; Jones Aff. 4 6; Myrick Aff. § 6; Taylor Aff. | 6;
Clayton Aff. § 11; Etheridge Aff. § 9; and Price Aff. 9 10.
18
used in drawing a court-created plan. See Watkins, 771 F. Supp. at 799. In Watkins, the three-judge
court noted that even a court-developed interim plan would not be practicable when the court was
issuing its opinion only three days before the candidate qualifying deadline, a date which already has
passed for this election.
Allowing elections to proceed in an orderly and timely manner is so important an interest of
the public that courts often allow elections to proceed even under plans which have already been
held unconstitutional or which are otherwise invalid.!* The logistics and timing of establishing a
new plan and election schedule compel the courts to allow defendants to proceed with imminent
election proceedings except under the most extraordinary circumstances. In Cosner, a three-judge
court allowed Virginia's 1981 legislative elections to proceed under a plan which it declared
unconstitutional. “Certification of candidates, ballot preparation, and a host of other election
mechanics must be undertaken promptly if the existing schedule is to be followed.” 522 F. Supp.
at 363. The court held the state’s plan unconstitutional and denied preliminary injunctive relief in
the same decision, issued only two weeks after the plan’s enactment. In another case, a court
allowed an election to go forward even under a plan which had been denied preclearance by the U.S.
Attorney General because “[t]he election is imminent, absentee balloting is scheduled to begin in
i As noted by the court in French v. Boner, 771 F. Supp. 896, 902, n.8 (M.D. Tenn.
1991), “other courts have withheld immediate injunctive or other equitable relief that would have
affected an impending election” (citing Chisom, 853 F.2d at 1192; Simkins, 631 F.2d at 295-296;
Maryland Citizens for a Representative Gen. Assembly v. Governor of Md., 429 F.2d 606, 609-611
(4th Cir. 1970); Banks v. Board of Educ. of Peoria, School Dist. No. 150, 659 F. Supp. 394, 398-403
(C.D. IL. 1987); Dillardv. Crenshaw County, 640 F. Supp. 1347, 1361-1363 (M.D. Ala. 1986); Mac
Govern, 637 F. Supp. at 115-116; Knox v. Milwaukee County Bd. of Elections Comm'rs, 581 F.
Supp. at 405; Martin v. Venables, 401 F. Supp. 611, 620-621 (D. Conn. 1975); and Dobson, 330 F.
Supp. at 1299-1302).
19
four days, and the county and city’s election machinery is in progress.” Campos, 776 F. Supp. at
307. Since “any change in the electoral scheme” at that point “would necessitate a separate city
election at considerable expense to the City,” the election was allowed to proceed under the
unprecleared plan as an interim measure. /d. at 308. Similarly, a three-judge district court in Texas
noted that it did not have time to draw a new legislative plan for the State of Texas, even one to be
used on an interim basis. between the end of January and March 12, 1982, the last date on which the
filing could be closed if elections were to be conducted on schedule. Accordingly. in order to permit
the legislative elections to go forward on a timely basis. the court adopted legislative districts
modified only slightly from ones for which the Attorney General had denied preclearance. Terrazas,
537 F. Supp. 514. Similar time constraints exist in North Carolina if the primary is to go forward
May 35, 1998, as scheduled.
The Supreme Court has cautioned that district courts in awarding or withholding relief should
consider the proximity of the forthcoming election and must
endeavor to avoid a disruption of the election process which might result from
requiring precipitate changes that could make unreasonable or embarrassing demands
on a State in adjusting to the requirements of the court’s decree.
Reynolds, 377 U.S. at 585,84 S. Ct. at 1394,12 L. Ed. 2d at 541. A three-judge court in this Circuit
recently recognized that granting a preliminary injunctionin a suit challenging Virginia’s legislative
redistricting plan would cause irreparable harm to the defendants in the expense and labor involved
in reconvening the General Assembly and in the disruption of the statewide election schedule.
Republican Party of Va., 774 F. Supp. at 403. See also Watkins, 771 F. Supp. at 801 (“Conducting
special elections. . . would lead to a lower voter turnout and extra expense for the State.”); Campos,
20
776 F. Supp. at 308 (goal to “minimize . . . taxpayer cost” resulting from separate election one of
several concerns which “would be thwarted by” postponement of the scheduled election).
Preparations for the upcoming election began shortly after adoption and approval of the
current plan and have proceeded apace. County boards of elections updated their precinct records;
voters were informed of their new districts; the candidate filing period opened and closed; first notice
of the primary election and registration deadline wis published; ballots were designed, printed and
distributed; voting, by absentee ballot, began.” The election process is moving inexorably to
conclusion. The Courts have recognized as valid considerations that the impending elections are
imminent, the election machinery is already in progress, and the election staff is readying the
precincts. French v. Boner, 771 F. Supp. 896, 902-903 (M.D. Tenn. 1991). Equity requires the
Court’s forbearance from “interfer[ing] with the conduct of rapidly upcoming elections where the
election machinery is already in gear.” Mac Govern, 637 F. Supp. at 115.
At this point in time, it is too late to draw new congressional districts and hold the scheduled
congressional primary on May 5, 1998. If the ballots cannot be ready and the congressional primary
cannot be held with all other primaries in 1998, past experience indicates that a separate
congressional primary would cost the State millions of dollars.'® The expense and labor entailed in
planning and administering a new election schedule compel denial of plaintiffs’ request for a pre-
liminary injunction.
15 See Second Bartlett Aff. 992, 4, 5, 7 and 9.
Ie See Second Bartlett Aff. 12.
21
D. VOTER CONFUSION AND CANDIDATE BURDEN.
Any attempt to provide for an election under new districts at this date could only engender
confusion and problems inconsistent with the goal of allowing North Carolina’s voters to elect
congresspersons of their choice. Thirty-one candidates have filed and are already campaigning;
(19 contested primaries are being conducted in eight districts.” “[T]he public interest favors an
electorate familiar with its candidates. . . . [A] rush to reorganize can only increase confusion
brought about by redistricting.” Republican Party of Va., 774 F. Supp. at 407. “The impending. . .
elections are imminent, and the election machinery is already in progress. The candidates have
qualified and are campaigning, the voters are preparing to make their choices and the election staff
is readying the precincts.” The Supreme Court has indicated that these are valid considerations. See
Reynolds, 377 U.S. at 585, 84 S. Ct. at 1393-94, 12 L. Ed. 2d at 541.
Courts may also consider the impact of enjoining an upcoming election on the candidates
who have already invested time and money in campaigning under the existing plan and schedule.
See Maryland Citizens for a Representative Gen. Assembly v. Governor of Md., 429 F.2d 606 (4th
Cir. 1970); Banks v. Board of Educ. of Peoria, School Dist. No. 150, 659 F. Supp. 394 (C.D. Ill.
1987); Dobson, 330 F. Supp. 1290. Six incumbent candidates (three Republicans and three
Democrats), who are experienced with the frontline mechanics of organizing, fundraising and
campaigning for election, have filed affidavits expressing concern that enjoining the election would
be confusing to the public and would not allow voters an adequate opportunity to learn about their
H See Second Bartlett Aff. 3.
22
new districts or to become familiar with the candidates.'!® All of the time. energy, money and effort
already expended by the candidates and their supporters will be unnecessarily wasted if the election
is halted at this late stage. The year-end financial reports of the congressional candidates (covering
the period from July, 1997, when the new plan was enacted, through December, 1997) show that
over three million dollars already had been contributed and more than one and one-half million
dollars had been spent by the time plaintiffs filed their motion for preliminary injunction.” It is far
too late to put the candidates “on notice,” as suggested by plaintiffs, that they should limit, minimize
or put on hold their electioneering efforts. Compromising the election process in this manner is
precisely the evil courts seek to avoid by refusing to enjoin ongoing elections. Furthermore,
attempting to substitute a different plan “would not give candidates enough time to decide whether
to run; it would not give those charged with elections enough time to prepare; and it would not give
voters adequate opportunity to familiarize themselves with their districts and their candidates.”
Watkins, 771 E. Supp. at 801.%
Disruption to other elections would also occur if a new congressional plan was put into place
with a new filing period and separate election. Filing for local, state and congressional offices
normally takes place all at the same time. Filing for local and state legislative offices has now
13 See Jones Aff. 99 4 and 7; Myrick Aff. 14, 6 and 7; Taylor Aff. 1] 4, 6 and 7;
Clayton Aff. 9 8 and 10; Etheridge Aff. 17, 9 and 10; and Price Aff. {9 and 11.
i See Second Bartlett Aff. § 13.
i See also Second Bartlett Aff. 9 8 and 9; Jones Aff. 19 4 and 7; Myrick Aff. 14 and
6; Taylor Aff. 9] 4 and 6; Clayton Aff. 99 8-10; Etheridge Aft. 177 and 9; and Price Aff. 7 8 and
9,
closed.’ The pool of potential candidates for congressional office is made up in large part of people
who are potential candidates for state and local offices. If a new and separate filing period is opened
for congressional elections, some persons who have already filed for local or state offices might be
tempted to refile for one of the newly designed congressional seats. This would disrupt the state and
local primaries with candidates abandoning those races remaining on those ballots, while new
candidates for state and local offices could not enter those races.”> The converse of this problem is
that potential candidates who have already foregone filing or refiling for state or local offices in
order to run for Congress, may find the newly created districts unfavorable to them, but they are
foreclosed now from entering state and local races.”
“Elections are for the voters; it is their opportunity to elect their representatives. . ..” Any
concerns of the court about the plan “are far outweighed by the benefits to the voters in these
elections.” Watkins, 771 F. Supp. at 804. “Holding the election on a timely basis will result in the
highest possible voter turnout, the least voter confusion, and a savings to the” State, making adher-
ence to the existing plan and schedule by far “the best option available” to the Court and to the
citizens of North Carolina. Campos, 776 F. Supp. at 308. If an invalid plan may be employed to
accomplish this purpose, as has been done so often, then clearly North Carolina’s 1997
2 See Second Bartlett Aff. § 2.
22 Because of this same potential harm, in 1992, when the state’s redistricting plans
were not precleared and it was necessary to delay the opening and closing of candidate filings for
the State House, State Senate and Congress for a short time, the General Assembly delayed candidate
filing deadlines for all partisan primaries. 1991 N.C. Sess. Laws, Extra Sess., ch. 1.
3 For example, the Court may take judicial notice that Representative Linwood E.
Mercer and Senator Daniel E. Page did not file for re-election to the North Carolina General
Assembly in order to run for Congress.
24
Congressional redistricting plan, “not presently held invalid, should be accorded the same
treatment.” Republican Party of Va., 774 F. Supp. at 407.
IV. PLAINTIFFS CANNOT SHOW A LIKELIHOOD OF SUCCESS ON THE MERITS.
Since the plaintiffs in this case cannot show that possible harm to them “decidedly”
outweighs the harm to the defendants, they must convince the Court of a significant likelihood that
they will prevail. “As the balance [of harm] tips away from the plaintiff, a stronger showing on the
merits is required.” Direx Israel, 952 F.2d at 813. In this case plaintiffs have not, and indeed
cannot, meet their burden to show they are likely to succeed on the merits of their claim. As already
set out in Defendants’ Brief in Opposition to Plaintiffs’ Motion for Summary Judgment and in
Support of Their Cross-Motion for Summary Judgment, North Carolina’s 1997
Congressional redistricting plan is a lawful exercise of the discretionary powers of the General
Assembly.?* The undisputed material facts establish that the 1997 plan lacks the earmarks of an
unconstitutionalracial gerrymander. Furthermore, race was not the predominate factor motivating
the legislature’sdecisions in drawing challenged Districts 1 and 12, and traditional districting criteria
were not subordinated to race.
The Supreme Court has placed a heavy burden of proof on plaintiffs asserting a claim of
racial gerrymandering. Proof that race was “a motivation for drawing of a majority-minority
district,” that “redistricting is performed with consciousness of race,” or that “traditional districting
criteria” were “neglected” are not sufficient to meet the plaintiffs’ burden. Bush v. Vera, 517 U.S.
2 Defendants will not repeat here the factual statement of the case and legal arguments
they made in their summary judgment brief, which the defendants incorporate herein by reference,
but will simply highlight points relevant to the preliminary injunction inquiry.
25
932, ,1168. Ct. 1941,1952-33, 135 L. Ed. 2d 243, 257-59 (1996) (emphasis in original).
Plaintiffs’ reliance on little more than a “fruit of the poisonous tree” theory and the racial
composition of certain districts cannot withstand defendants’ summary judgment motion and
certainly fails to establish a likelihood of success on the merits.
The gravamen of plaintiffs’ complaint is their aversion to the 1992 plan. They are not
satisfied solely with remedying the unconstitutional features of that plan, but seek to obliterate all
traces of Districts 1 and 12. The Supreme Court has made quite clear, however, that federal court
review of districting legislation “represents a serious intrusion on the most vital of local functions”
and has admonished the lower courts “to exercise shelnninory caution in adjudicating claims that
a state has drawn district lines on the basis of race.” Miller v. Johnson, 515 U.S. _, 1158S.
Ct. 2475, 2488, 132 L. Ed. 2d 762, 779 (1995). Thus, in reviewing the State’s 1997 plan, “the
discretion of the federal court is limited except to the extent the plan itself runs afoul of federal
law.” Lawyer v. Departmentiof Justice, 521 U.S. = .117:8.Ct.2186,2193, 138 L.Ed. 2d
669, 680 (1997).
The 1997 plan is supported by a new legislative record separate from the 1992 legislative
record. It was proposed by new congressional redistricting committees and enacted by a different
General Assembly. The 1997 plan reflects the current legislature’s different goals and eliminates
the earmarks of a racial gerrymander. Under these circumstancesthe Court is limited to determining
“whether the proffered remedial plan is legally unacceptable because it violates anew constitutional
or statutory voting rights -- that is, whether it fails to meet the same standards applicable to an
original challenge of a legislative plan in place. Upham v. Seamon, 456 U.S.37,42,102 S. Ct. 1518,
1521, 71 L. Ed. 2d 725 (1982).” McGhee v. Granville County, N.C., 860 F.2d 110, 115 (4th Cir.
26
1988). Plaintiffs’ complaints about the 1992 plan and its elected representatives are irrelevant to
this Court’s current inquiry and are insufficient to establish a claim against the 1997 plan.
Similarly, plaintiffs’ reliance on the racial demographics of the challenged districts is
unavailing. “If district lines merely correlate with race because they are drawn on the basis of
political affiliation, which correlates with race, there is no racial classification to justify.” Bush v.
Vera, 116 S. Ct. at 1956, 135 L. Ed. 2d at 263. District 12 separates Democratic voters from a sea
of Republican voters.” The “law does not condemn political partisanship,” even in a majority-
minority district, as unlawful racial gerrymandering. Moon v. Meadows, 952 F. Supp. 1141, 1148
(E.D. Va. 1997). With respect to District 1, plaintiffs concede that this district in the state’s
northeastern region has historic and demographic legitimacy. This district encompasses a
geographically compact and politically cohesive concentration of African-Americans whose
preferred candidates historically have been defeated by the white majority voting as a bloc.”
Plaintiffs’ theory that a 50.27% African-American total population majority constitutes an
unnecessary ‘“over-concentration” of minority voters is no more than uninformed speculation
unsupported by fact or law.
CONCLUSION
The State’s 1998 congressional elections should not be disrupted based on an uncertain cause
of action alleging possible theoretical harm to a handful of voters from two districts, compared to
the greater harm to the other more than six million citizens of the State of North Carolina should the
2 See Cooper Aff. 9 14; Peterson Aff. 9 3 and 21.
i See Bartlett Aff., Vol. IV at 97C-28F-3B, Witness Statements, Tab. 2, Expert Rpt.
of Dr. Engstrom, pp. 4-21 and 27-28; Vol. V at 97C-28F-4D(3), Att. 4.
27
upcoming election be postponed. The State of North Carolina should be allowed to get on with the
business of electing its congressional representatives without unwarranted interference by the federal
courts.
This the 20th day of March, 1998.
MICHAEL F. EASLEY
ATTORNEY GENERAL
(—
Edwin M. Speas, Jr.
Senior Deputy Attorney General
N.C. State Bar No. 4112
A
Tiare B. Smiley
Special Deputy Attorney General
N. C. State Bar No. 7119
Norma S. Horal
Special Deputy Attorney a
N.C. State Bar No. 6654
N.C. Department of Justice
P.O. Box 629
Raleigh, N.C. 27602
(919) 716-6900
CERTIFICATE OF SERVICE
This is to certify that I have this day served a copy of the foregoing Defendants’ Brief In
Opposition To Motion For Preliminary Injunction and the Affidavits of Congresspersons
Walter B. Jones, Sue Myrick, Charles H. Taylor, Eva M. Clayton, Bob Etheridge and David
E. Price, and Second Affidavit of Gary O. Bartlett in the above captioned case upon all parties
by depositing these documents in the United States mail, first class mail, postage prepaid addressed
as follows:
Robinson O. Everett
Suite 300 First Union Natl. Bank Bldg.
301 W. Main Street
P.O. Box 586
Durham, NC 27702
Martin B McGee
Williams Boger Grady Davis & Tittle PA
Post Office Box 810
Concord NC 28026-0810
ATTORNEYS FOR PLAINTIFFS
Anita S. Hodgkiss
Ferguson, Stein, Wallas, Adkins.
Gresham & Sumter, P.A.
741 Kenilworth Avenue
Charlotte, NC 28204
ATTORNEYS FOR APPLICANTS FOR INTERVENTION
This the 20th day of March, 1998.
\
il 5. Lior
Z
TE Smiley I
Special Deputy Attorney Genera
20
UNITED STATES DISTRICT COURT
EASTERN DISTRICT OF NORTH CAROLINA
EASTERN DIVISION
Civil Action No. 4-96-CV-104-BO(3)
MARTIN CROMARTIE, THOMAS )
CHANDLER MUSE, and GLENNES )
DODGE WEEKS,
Plaintiffs,
V.
JAMES B. HUNT, JR., in his official
capacity as Governor of the State of North
Carolina, et al.,
Defendants.
AFFIDAVITS FILED BY DEFENDANTS
RELATING TO SUMMARY JUDGMENT
AND PRELIMINARY INJUNCTION PROCEEDINGS
5
SENATOR ROY A. COOPER, III
REPRESENTATIVE W. EDWIN M'MAHAN
DR. DAVID R. GOLDFIELD
DR. DAVID W. PETERSON
UNITED STATES DISTRICT COURT
EASTERN DISTRICT OF NORTH CAROLINA
EASTERN DIVISION
Civil Action No. 4-96-CV-104-BO(3)
MARTIN CROMARTIE, THOMAS )
CHANDLER MUSE, and GLENNES )
DODGE WEEKS.
Plaintiffs,
V.
AFFIDAVIT OF
JAMES B. HUNT. JR, in his official ROY A. COOPER, III
capacity as Governor of the State of North
Carolina. et al.,
Defendants.
Roy A. Cooper, III, being first duly sworn deposes and says:
5 [ am a native of Nash County, North Carolina. After receiving my undergraduateand
law degrees from the University of North Carolina at Chapel Hill, I returned home to Nash County
where I have practiced law since 1982. A copy of my resume is attached to this affidavit.
2 In 1986, 1988 and 1990, 1 was elected to the North Carolina House of Representatives
and in 1992, 1994 and 1996, I was elected to the North Carolina Senate. During the 1996 Session
of the General Assembly, I served as Chairman of the Senate Judiciary Committee and the Senate
Select Committee on Congressional Redistricting. I had not previously served on any redistricting
committee.
3. My responsibility as Chairman of the Senate Redistricting Committee was to attempt
to develop a new congressional plan that would cure the constitutional defects in the prior plan, and
that would have the support of a majority of the members of the Senate. which was controlled by the
Democrats. and the support of a majority of the members of the House. which was controlled by the
Republicans. Under an order entered by the three-judge court in Shaw v. Hunt. the new plan had to
be completed by March 31, 1997, to avoid the federal court imposing a plan on the State. The
Senate's efforts to meet this responsibility are recorded in the transcripts of the meetings of the
Senate Committee and of the debates on the floor of the Senate. A true and accurate copy of these
transcripts is included in the North Carolina Section 5 Submission. 1997 Congressional Redistricting
Plan (filed with the Affidavit of Gary O. Bartlett) as Attachments 97C-28F-4D(1)-(4).
4. Representative W. Edwin McMahan was appointed Chairman of the House
Redistricting Committee by Speaker Brubaker. His responsibilities were essentially identical to
mine.
s. Many people doubted that the General Assembly would be able to achieve a
compromise between the Democratic controlled Senate and Republican controlled House.
Redistricting generally is a task which becomes extremely partisan. Working with the leadership
of the Senate and the House, however, Representative McMahan and I early on identified a single
path by which a compromise might be reached and a new plan adopted. This path was to crafta plan
which would cure the defects in the old plan and at the same time preserve the existing partisan
balance in the State’s congressional delegation. The Senate Redistricting Committee made the first
attempt to travel down this path.
6. On February 20, 1997, after consultation with other Senate members, I presented a
proposed plan, entitled Congressional Plan A (hereinafter Plan A), to the Senate Redistricting
Committee. This plan was similar to alternative plans later proposed by the House Redistricting
2
Committee and Representative McMahan and to the plan ultimately enacted by the General
Assembly. Because Plan A turned out to be the prototype for the enacted plan. I will describe the
goals the Senate leadership and I wanted to achieve in designing this plan. In addition, I will
describe the process used to draw the districts in Plan A to achieve those goals. Particular attention
will be given to Districts 1 and 12.
7 We had two goals for the plan as a whole. The first goal was to cure the
constitutional defects in the prior plan by assuring that race was not the predominate factor in
constructing any district in the plan and to assure that traditional redistricting criteria were not
subordinated to race. To accomplish this first goal, emphasis was placed on the following factors
in constructing the plan: (1) avoidance of division of precincts; (2) avoidance of the division of
counties when reasonably possible: (3) functional compactness (grouping together citizens of like
interests and needs); (4) avoidance of long narrow corridors connecting concentrations of minority
citizens; and (5) ease of communication among voters and their representatives. A comparison of
the unconstitutional 1992 plan and Plan A demonstrates that this goal was accomplished. For
example: (1) the unconstitutional plan divided 80 precincts while Plan A divided only 2 precincts
(both of which were divided only to accommodate peculiar local circumstances); (2) the
unconstitutional plan divided 44 counties while Plan A divided only 22; (3) the unconstitutional plan
divided 7 counties among 3 districts while Plan A did not divide any county among 3 districts; (4)
the unconstitutional plan used “cross-overs,” “double cross-overs” and “points of contiguity” to
create contiguous districts while Plan A used none of these devices.
8. Our second goal, and the goal that made it possible for the General Assembly to agree
upon and enact a new plan, was to maintain the existing partisan balance in the State’s congressional
~
J
delegation, 6 Republicans and 6 Democrats. Based on my discussions with Senate leaders and with
Representative McMahan. I knew that any plan which gave an advantage to Democrats faced certain
defeat in the House while any plan which gave an advantage to Republicans faced certain defeat in
the Senate. Preserving the existing partisan balance, therefore, was the only means by which the
General Assembly could enact a plan as required by the Court. To achieve this pivotal goal. we
designed Plan A to preserve the partisan core of the existing districts to the extent reasonably
possible and to avoid pitting incumbents against each other. One tool I used to measure the partisan
nature of districts was election results gathered and analyzed by the National Committee for an
Effective Congress NCEC). The NCEC information was based on the results of a series of elections
from 1990 to 1996. I also used older election results contained in the legislative computer data base.
In the end, these election results were the principal factor which determined the location and
configuration of all districts in Plan A so that a partisan balance which could pass the General
Assembly could be achieved.
3 The two goals we applied in drawing the plan as a whole were also applied in drawing
Districts 1 and 12. To assure that race did not predominate over traditional redistricting criteria,
District 12 was drawn so that (1) only 1 precinct was divided (a precinct in Mecklenburg County that
was divided in every local districting plan); (2) its length was reduced by 46% (from approximately
191 miles to 102 sition) so that it became the third shortest district in the state; (3) the number of
counties included in the district was reduced from 10 to 6; (4) all “cross-overs,” “double cross-overs”
and “points of contiguity” were eliminated; and (5) it was a functionally compact, highly urban
district joining together citizens in Charlotte and the cities of the Piedmont Urban Triad. To assure
that race did not predominate over traditional redistricting criteria, District 1 was drawn so that (1)
4
no precincts were split: (2) the number of counties included in the district was reduced from 28 to
20: (3) the number of divided counties included in the district was reduced from 18 to 10: (4) all
“cross-overs.” “double cross-overs” and “points of contiguity” were eliminated: (5) the length of the
district was reduced by 24% (from approximately 225 miles to 171 miles): and (6) it was a
functionally compact district joining together citizens in most of the rural and economically
depressed counties in the northern and central Coastal Plain region of the State.
10. Maintaining Districts 1 and 12 as Democratic leaning districts was critical to
achieving the pivotal goal of protecting the partisan balance in the State's congressional plan.
Achieving this goal for Districts 1 and 12. however, presented special problems. First. the House
insisted that District 1 had to be drawn in a manner that protected Congressman Jones in District 3
and that avoided placing Congressman Jones’ residence inside the boundaries of District 1. Second,
District 12 had to be drawn in a manner that avoided placing Congressman Burr’s and Coble’s
residences inside the boundaries of District 12. Third, District 12 had to be drawn in a manner that
would not include Cabarrus County, Congressman Hefner's home county. Fourth, significant
portions of Congressman Watt’s and Congresswoman Clayton’s former districts had been eliminated
because of the directive in Shaw v. Hunt, thus lessening their strength as incumbents. Finally, we
were concerned that Congressman Watt might lose some votes because of his race and that
Congresswoman Clayton almost certainly would lose votes because of her race. To help protect
District 1 as a Democratic leaning district, we included the heavy concentrations of Democratic
voters in the cities of Rocky Mount, Greenville, Goldsboro, Wilson and Kinston, and to help protect
District 12 as a Democratic leaning district, we included the heavy concentrations of Democratic
voters in Charlotte, Greensboro and Winston-Salem in the district.
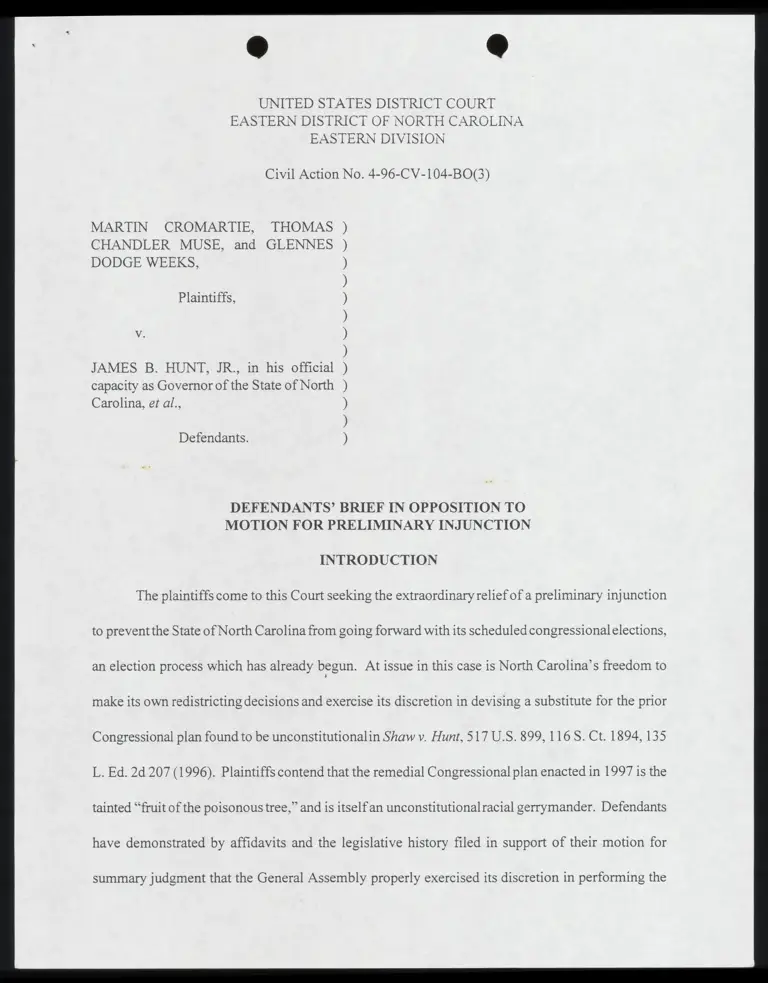
11. In developing Congressional Plan A. I also became convinced from expert studies
before the General Assembly and my own knowledge and experience that Section 2 of the Voting
Rights Act likely required the creation of a majority-minority district in the central to northern part
of the Coastal Plain. where the largest concentration of black citizens reside. See the attached map
entitled, North Carolina Counties by Percent of Population Black. which illustrates the correlation
between the boundaries of District 1 and this concentration of black citizens. That belief was
balanced with my primary goals of curing the defects in our prior plan and protecting the existing
partisan balance in the Congressional delegation in locating and drawing District 1 in Congressional
Plan A.
12. On February 20, 1997, I presented Congressional Plan A to the Senate Redistricting
Committee and on February 23, 1997, Representative McMahan presented his first plan,
Congressional Plan A. 1, to the House Redistricting Committee. Congressional Plan A and A.1 were
similar. Based on NCEC electionresults, however, I was concerned that Representative McMahan’s
plan unnecessarily diminished Democratic performance in Districts 2. 8 and 12, Congressmen
Hefner's, Etheridge’s and Watt’s districts.
13, Over the next several weeks, Representative McMahan and [ were able to resolve my
concerns and the concerns of the Senate leadership by negotiation. The compromise we reached
finally was reflected in a plan entitled “97 House/Senate Plan.” This is the plan that was enacted by
the General Assembly on March 31, 1997. The first plan, “Congressional Plan A,” and “97
House/Senate Plan,” the enacted plan, are very similar. One of the differences is that the first plan
had 24 divided counties while the enacted plan reduced the number of divided counties to 22.
14. The “97 House/Senate Plan” is a negotiated bipartisan plan which contains districts
6
located and shaped in a manner to avoid constitutional problems and to protect the existing partisan
balance in the State's Congressional delegation. Racial fairness was, of course, considered in the
development of the plan. Our obligations to represent all of our constituents of all races and to
comply with the Voting Rights Act demanded that racial fairness be considered. The plan enacted
is racially fair, but race for the sake of race was not the dominate or controlling factor in the
development or enactment of the plan. In drawing initially Congressional Plan A and in negotiating
the eventually enacted plan, partisan election data, not race. was the predominant basis for assigning
precincts to districts including precincts in Districts 1 and 12. That a large proportion of precincts
assigned to District 12 have significant black populations is simply the result of a strong Democratic
voting pattern among blacks. Moreover, District 12 is not even composed of a majority of black
citizens; it is a district in which white citizens constitute 52% of the district’s total population, 53%
of the districts’ voting age population and 54% of the districts’ registered voters. Simply, District
12 is a Democratic island in a largely Republican sea.
This the RS ey of February, 1998.
IG A lopen, TC
Roy A. Cooper, 3= 71]
Sworn to and subscribed before me this
2670. day of February, 1998.
ik lh ag
Lin ll fad
Notary Public
My commission expires: / / 2 3000
a
3
1
0
A
0
3
H
L
a
3
0150-222-008-1
“OO
A
1
d
d
N
S
T¥H3IT
I
L
V
I
S
-
1
I
V
North Carolina Counties by Percent of Population Black with 1st Congressional District Overlay
Xi
Currituck
kingham 11.25
20.39.
Dare
3.57
= 22.82 as saad hme Ban
Johnston
“37.70
Lee
22.72
Harnett
22.58
~~ Moore
Pamlico
25.95
1st District
Percent Black
0.01-4.66
466-1594
Carteret
8.34
15.94 - 25.95
25.95- 37.66
37.66-61.46
Onslow
rt ey Crested by the North Carona General Assembly Informanon Systems Division. February 24. 1998
Robeson
Age:
Occupation:
Elective
Offices:
Education:
Family:
Selected
Government
Positions:
Professional:
Selected
Civic and
Religious:
Roy A. Cooper, III
P.O. Box 4538
Rocky Mount, NC 27803-0538
(919) 442-3115
40: Born June 13, 1957
Attorney
N.C. State Senator 1991-present
N.C. House of Representatives 1987-1991
B.A., 1979 and J.D., 1982 from the University of North Carolina at Chapel Hill
Wife, Kristin and children Hilary, Natalie and Claire
Senate Majority Leader 1997-present
Current Chairman, Senate Judiciary Committee
Current Chairman, Senate Select Committee on Congressional Redistricting
Current Chairman, Senate Select Committee on Length of the Session
Current Co-Chairman, Joint Legislative Ethics Committee
Past Chairman, Senate Judiciary I/Constitution Committee
Past Chairman, Senate Judiciary II Committee
Past Chairman, Senate Economic Development Committee
Past Chairman, Select Committee on Courts
Past Chairman, Study Commission on the Juvenile Code
Past Chairman, Public Health Study Commission
Past Chairman, House Judiciary Committee
Past Chairman, Study Committee on Criminal Law
Current and past member of numerous other legislative committees, government
commissions and study committees
Managing Partner in the Law Firm of Fields & Cooper in Rocky Mount.
N.C. Bar Association: Member and CLE Instructor.
N.C. Academy of Trial Lawyers: Member and CLE Instructor.
Martindale- Hubbell “AV” rating.
Deacon in First Presbyterian Church of Rocky Mount, NC
Co-Chairman, Rocky Mount March of Dimes Chefs Auction
Board of Visitors of North Carolina Wesleyan College
Chairman, 1997-98 Rocky Mount Area United Way Campaign
Board of Directors, Visions, Inc.
Board of Directors, Tar River Chorus and Orchestra
Board of Directors, Rocky Mount American Heart Association
Honors and
Activities
while at
:
University
Activities
since
graduation:
Selected
Successful
Legislation
Introduced:
Other
Awards
and Honors:
Board of Directors, Rocky Mount Area United Way
Rocky Mount Chamber of Commerce
Member and former legal counsel of Rocky Mount Jaycees (Project Chairman
for several events)
Board of Directors of North Carolinians for Community Colleges
OIC Industrial Advisory Council
Teach for America Advisory Council
Morehead Scholar
Order of the Golden Fleece
Order of the Grail
Order of the Old Well
Dean's List
Chief Justice of Student Supreme Court
President of UNC Young Democrats
Student Government Cabinet
Chairman, Edgecombe/Nash Morehead Scholarship Selection Committee
UNC Board of Visitors
Board of Directors of UNC Law Alumni Association
Life Member, UNC General Alumni Association
Gubernatorial Veto Constitutional Amendment
Open Meetings Law
Open Public Records Law
Non-Partisan Election of Superior Court Judges Bill
Environmental Crimes Bill
No Guns in School Safety Bill
Distinguished Young Alumnus Award, UNC-Chapel Hill
Order of the Long Leaf Pine Honor Society
N.C. Jaycees Freedom Guard Award
N.C. Press Association Legislator of the Year
N.C. Academy of Trial Lawyers Legislator of the Year
N.C. Cued Speech Legislative Award
Rocky Mount Jaycees Distinguished Service Award
In 1988, selected as the "Most Effective" Freshman Representative in the N.C.
House by the non-partisan N.C. Center for Public Policy Research
In 1996, ranked as the fourth most effective Senator in the N.C. Senate by the
same organization
}
0
0
A
d
d
N
S
T
¥
O
3
T
3
L
V
L
S
=
(
d
3
7
0
A
0
3
d
LLa3
UNITED STATES DISTRICT COURT
EASTERN DISTRICT OF NORTH CAROLINA
EASTERN DIVISION
Civil Action No. 4-96-CV-104-BO(3)
VIARTIN CROMARTIE, THOMAS )
CHANDLER MUSE, and GLENNES )
DODGE WEEKS.
Plaintiffs,
AFFIDAVIT OF
Ww. EDWIN MCMAHAN
V.
JAMES B. HUNT, JR., in his official
capacity as Governor of the State of North
Carolina, et al.,
Defendants.
W_ Edwin McMahan, being first duly sworn, deposes and says:
E [ am a native of Buncombe County, North Carolina and have resided in Charlotte,
North Carolina since 1974. A copy of my resume is attached.
2. In 1994 and 1996, I was elected to the North Carolina House of Representatives.
During the 1997 Session of the General Assembly, Harold J. Brubaker, Speaker of the House,
appointed me to serve as Chairman of the House Congressional Redistricting Committee. I had no
previous involvement in congressional redistricting.
3. My responsibility as Chairman of the House Redistricting Committee was to attempt
to develop a new congressional plan that would cure the constitutional defects in the prior plan, and
that would have the support of a majority of the members of the Senate, which was controlled by the
Democrats; and the support of a majority of the members of the House, which was controlled by the
Republicans. Under an order entered by the three-judge court in Shaw v. Hunt. that task had to be
completed by March 31. 1997, to avoid the federal court imposing a plan on the State.
4. Senator Roy A. Cooper. III, was appointed Chairman of the Senate Redistricting
Committee by President Pro Tem Marc Basnight. His responsibilities were essentially identical to
mine.
Many people doubted that the General Assembly would be able to achieve a
compromise between the Democratic controlled Senate and Republican controlled House on the
most partisan legislative task, redistricting. Working with the leadership of the Senate and the House
respectively, however. Senator Cooperand I early on identified a single path by which a compromise
might be reached and a new plan adopted. This path was to craft a plan which would cure the
defects in the old plan and at the same time preserve the existing partisan balance (6 Republicans
and 6 Democrats) in the State’s congressional delegation.
6. To cure the constitutional defects in the prior plan, we had to be sure that traditional
redistricting criteria were not subordinated to race. To achieve this goal, the leadership of the House
and I wanted to avoid splitting any precincts, to avoid splitting counties when reasonably possible,
to eliminate all of the “cross-overs,” “double cross-overs” and “points of contiguity” from the prior
plans, to facilitate communication among voters in a district and their representatives in Congress,
and to place citizens with similar needs and interests in the same districts to the extent reasonably
possible.
7. To protect the existing partisan balance, the leadership of the House and I recognized
that we would need to protect incumbents and to preserve the cores of the prior districts to the extent
consistent with our goal of curing the defects in the prior plans. The means [ used to check on the
2
partisan nature of proposed new districts was the election results in the General Assembly's
computer data base (the 1990 Helms-Gantt election and the 1988 elections for Lieutenant Governor
and one of the Court of Appeals seats). I also used more recent election results to evaluate the
proposed Districts 2 and 4 -- the districts that we felt were the most competitive from a partisan
viewpoint.
8. On February 20, 1997, Senator Cooper presented C ongressional Plan A to the Senate
Redistricting Committee and on February 25, 1997, I presented Congressional Plan A.1, to the
House Redistricting Committee. Congressional Plan A and A.l were similar.
gS, Over the next several weeks Senator Cooper and I were able to resolve the few
differences between the two plans. The compromise we finally reached is reflected in a plan entitled
“97 House/Senate Plan A.” This is the plan that was enacted by the General Assembly on March
31, 1997. It achieves the goals the leadership of the House and I had. It cures the constitutional
defects in the prior plan and it protects the existing partisan balance in the State's Congressional
delegation. The plan also meets one-person, one-vote requirements and, with regard to District 1,
meets Voting Act requirements.
10. 97 House/Senate Plan A 1s not an unconstitutional racial gerrymander. 97
House/Senate Plan A is a negotiated bipartisan plan which contains districts located and shaped in
a manner to avoid constitutional problems and to protect the existing partisan balance in the State’s
Congressional delegation. Racial faimess was, of course, considered in the development of the plan.
Our obligations to represent all of our constituents of all races and to comply with the Voting Rights
Act demanded that racial fairness be considered. The plan enacted is racially fair, but race for the
sake of race was not the dominate or controlling factor in the development or enactment of the plan.
~
Fr
The dominate and controlling factors in developing the plan were (1) curing the constitutional
defects in the prior plan and (2) protecting the existing partisan balance. Two indications that race
was not dominate in drawing the plan are the fact that 12 of the 17 members of the House who are
black voted against 97 House/Senate Plan A and the fact that two black members of the House,
Representatives Fitch and Michaux. have claimed that the plan we enacted is not racially fair to
blacks.
11. The efforts by the House of Representativesto meet their responsibilitiesin enacting
a new congressional redistricting plan are recorded in the transcripts of the meetings of the House
Redistricting Committee and the debate on the floor of the House. A true copy of these transcripts
is included in the North Carolina Section 5 Submission, 1997 C ongressional Redistricting Plan (filed
with the Affidavit of Gary O. Bartlett) as Attachments 97C-28F-4E(1) through 97C-28F-4F(1).
This the 26th day of February, 1998.
/V.Cl/
150 /V Hele
W. Edwin McMahan
Sworn to and subscribed before me this
26th day of February, 1998.
Ra Lea (rz me
Ndftary Public /
My commission expires: _/2 —2 0" Ga
W. Edwin McMahan
Personal:
Birthdate: August 13, 1944 in Asheville, North Carolina
Married with three children
Residence: 3007 Clarendon Road, Charlotte, NC 28211
Education:
University of North Carolina, Bachelor of Science (1966), Industrial Relations
Emplovment:
1966-1971 Mortgage Loan District Supervisor, Jefferson Standard Mutual Life
1971-1974 Senior Vice President, Commercial and Residential Real Estate Division,
Carolina National Mortgage Investment Company (A subsidiary of C&S Bank of
South Carolina)
1974-Present Chief Executive Officer, Little and Associates Architects
President, LMG Properties, Inc. (An affiliate of the Little-McMahan Group)
Current Appointments:
Chairman- Legislative Congressional Redistricting Committee
Co-Chairman- Appropriations Committee on Transportation
Member- North Carolina House Finance Commuttee
Member- North Carolina House Appropriations Committee
Member- North Carolina House Education Commuttee
Member- North Carolina House Rules and Operations Committee
North Carolina House Appointee- Southern Growth Policy Board
Member- Board of Directors of the North Carolina Center for Business and Industry
Member- Board of Directors of the Blumenthal Performing Arts Center
Member- Board of Directors of the North Carolina Public Schools Parmership for Excellence
Former Appointments:
Chairman- North Carolina Redistricting Committee
Chairman- North Carolina Non-Profit Study Commission
Co-Chairman- North Carolina Lien Laws Review Commission
Member- North Carolina House and Senate Education Oversight Commuttee
Member- North Carolina House and Senate Transportation Oversight Committee
Chairman- City of Charlotte Zoning Board of Adjustments
Chairman- Charlotte Chamber of Commerce Land Use Commuttee
Chairman of the Board- Crisis Assistance Ministry
Vice Chairman- Salvation Army Board
Vice Chairman- St. Mark’s Lutheran Church Board
President- Myers Park Country Club
Member- Charlotte Chamber Advisory Board
Member- Charlotte Tree Commission
Member- 2013 City of Charlotte Transportation Committee
C:\win\ed\biography2.doc
Former Appointments (Continued):
Member- Carolina’s Partnership Coalition Committee
Member- City of Charlotte Storm Water Task Force
Honors and Awards:
1972- Mortgage Bankers Association “Man of the Year”
1997- N.C. Chapter of the American Society of Landscape Architects Legislator and
Citizenship Awards
C:\win\ed\biography2.doc
a
3
7
0
A
0
3
H
L
a
s
)150-222-008-1
"OO
A
T
d
d
N
S
T¥O3IT
I
L
V
I
S
-
1
V
UNITED STATES DISTRICT COURT
EASTERN DISTRICT OF NORTH CAROLINA
EASTERN DIVISION
Civil Action No. 4-96-CV-104-BO(3)
MARTIN CROMARTIE, THOMAS )
CHANDLER MUSE, and GLENNES )
DODGE WEEKS,
Plaintiffs,
AFFIDAVIT OF
DR. DAVID R. GOLDFIELD
V.
JAMES B. HUNT, JR., in his official
capacity as Governor of the State of North
Carolina, et al.,
N
a
’
N
e
’
N
e
N
e
N
e
N
a
N
a
N
e
N
a
N
e
N
e
Defendants.
David R. Goldfield, being duly sworn, deposes and says:
I have been the Robert Lee Bailey Professor of History at the University of North
Carolina at Charlotte since 1982. I earned a BA (cum laude) in political science from Brooklyn
College of CUNY and both an MA and my PhD in history from the University of Maryland. My
primary research and teaching emphases are in Southern history, urban history and the civil rights
era. | have written or edited twelve books on various aspects of Southern history, urbanization and
race relations, two of which were nominated for the Pulitzer Prize in history. In addition, I have
authored numerous articles for scholarly refereed journals. For several years I have worked
periodically for the United States Information Agency making presentations on race relations and
urbanization to business and educational groups in Asia and Europe, and for the U.S. Department
of Justice on federal voting rights cases. A copy of my resume is attached.
a I was asked by representatives of the North Carolina Attorney General’s Office to
examine the history of the area generally encompassed by the First Congressional District created
by the North Carolina General Assembly in 1997.
~
3. A Tue copy of my report in response to that request is attached hereto and
incorporated by reference.
This the Z& "day of February, 1998.
NWT)
David R. Goldfield, PhD |
My commission expires: £22079
REPORT
January 13, 1998
Submitted by David Goldfield, Ph.D., Robert Lee Bailey Professor of History
University of North Carolina, Charlotte
I have been asked to examine the history of the area generally encompassed by the First
Congressional District created by the North Carolina General Assembly in 1997.
The new First Congressional District in eastern North Carolina responds to two historical
legacies. First, the District includes counties and towns where black populations have been
concentrated more than in other areas of the state. This concentration has been the focal point
both for black political influence since the Reconstruction era and corresponding attempts by
white leaders to dilute or eliminate that influence. Perhaps the most striking feature of the new
First Congressional District is its resemblance to the historic “Black Second,” the source of black
political power in post-Civil War North Carolina and a lightning rod for racial conflict. Second,
the economies of the counties and towns of the First Congressional District have remained
relatively static at best in a state that has urbanized rapidly and experienced significant economic
development during the second half of the twentieth century. The economic experiences of
District citizens, particularly since the end of World War II, have reinforced a community of
interest that has existed since the Reconstruction era.
A Legacy of Racial Discrimination
The boundaries of the new First Congressional District resemble the boundaries of the old “Black
Second.”! When the Democratic party regained power in North Carolina in 1872, it immediately
sought to address the racial “problems” created by the enfranchisement of former slaves in 1868.
Freedmen were heavily concentrated in the eastern part of the state. In an effort to “pack” the
black vote, i.e., isolate it, and ensure solid Democratic majorities in other districts, lawmakers
created the Second Congressional District. The Black Second, as it was known, included
Warren, Northampton, Halifax, Edgecombe, Wilson, Wayne, Lenoir, Craven, Greene, and Jones
counties. All or parts of these counties are included in the new First Congressional District. All
of these counties, with the exception of Wayne and Wilson, possessed black population
majorities in the late nineteenth century. Even these two “white” counties, had black populations
exceeding 45 percent.
Unfortunately for the Democrats, their political solution worked too well. The creation of a
political district that gave black politicians a realistic opportunity to win elections energized the
black electorate; black voter turnout exceeded 80 percent during the early 1870s. Before a
constitutional amendment in 1900 effectively disfranchised black voters in North Carolina, four
black Congressmen represented the district, serving a total of seven terms. George White, who
ended his term in 1901, was the last black Congressman from the South until 1973. Equally
important, these black Congressmen helped secure political patronage positions for their black
constituents, such as postmaster, tax collector, and recorder of deeds. During the period 1872 to
1900, almost all of the fifty-nine blacks who sat in the state house of delegates, and eighteen
blacks who served in the senate, were from districts wholly or partially within the boundaries of
the Black Second.’
This is not to say that white voters in the Black Second were disfranchised or were
unsuccessful in achieving political office, especially at the local level. But the emergence of an
active black electorate required whites to share power with blacks, a prospect most white leaders
in the district found demeaning or unacceptable. These counties, most of which were located in
the Coastal Plain, were among the state’s most conservative jurisdictions.
Before the Civil War, white politicians from these counties dominated affairs in Raleigh and
were reluctant to share power with counties to the west. Although North Carolina was not a
plantation state on the order of lower South states such as Alabama and Mississippi, areas within
the Black Second had resembled the Old South more than the Old North State in the pre-Civil
War era. Here were plantations, large landowners, and the most significant concentrations of
slaves. It was a relatively homogeneous area, different from the ethnic and religious diversity of
the Piedmont, and much more content to adhere to the status quo of low taxes and low state
expenditures. By the 1830s, North Carolina was known as the “Rip Van Winkle State,” an
image sustained by the dominance of the eastern elite. Not until the administration of Governor
John Motley Morehead in the 1840s and the growing influence of Piedmont counties in state
government, did North Carolina shake its torpor and begin an extensive program to improve
transportation, communication, and education throughout the state -- programs that probably
would not have existed if eastern leaders had maintained control of the state government.”
The Civil War and its outcome did not change the conservative character of the District.
While the Piedmont forged ahead with railroad projects and textile and tobacco manufacturing,
much of eastern North Carolina turned its attention to regaining control over its black agricultural
workforce and restoring white supremacy. The Black Second gave blacks political influence not
envisioned by the old aristocracy. It is not surprising that the three leaders of black
disfranchisement in North Carolina, Charles Brantley Aycock, Josephus Daniels, and Furnifold
Simmons, all resided in the Black Second. Aycock was a native of Wayne County, Daniels
hailed from Wilson, and Simmons came from Jones County.
Responding to white pressure within the Black Second, Democrats began to whittle away
both at the district boundaries and black voting rights from 1877 until 1900. In 1877, Democrats
removed county offices from the electoral process; henceforth the state legislature would appoint
those officials. Democrats also redrew ward lines within the Black Second to either limit black
influence to one district or disperse the black vote among numerous districts. Finally, the
Democrats appointed voting registrars sympathetic to their views. The collective result was to
increase Democratic control throughout the Black Second. Democrats tightened suffrage laws
over the next decade further restricting the black vote. By 1886, a white Congressman
represented the Black Second, even though the legislature had increased the percentage of black
voters in the district in 1883 with the addition of Bertie and Vance counties and the removal of
Wayne County. (Bertie and Vance are also included in the new First Congressional District.) In
1891, the Democrats scrapped the Black Second in all but name, and redrew the state’s
Congressional districts, seeking “to make compact districts, and also to make them all
Democratic.” Jones, Craven, and Vance counties were removed from the Black Second and
Wayne County put back in.’
But an economic crisis that thrust tens of thousands of white landowners into tenantry
throughout the South, especially in the cotton-growing regions (and the Black Second was North
Carolina’s major cotton-growing area), inspired white voters to seek out political alternatives to
the Democratic party. The Populist party responded to the needs of these farmers and, in North
Carolina, the party fused with Republicans to capture the state legislature in 1894. The “Fusion”
government undid most of the vote dilution legislation implemented by the Democrats. The
Fusionists, however, succumbed to a withering white supremacy campaign undertaken by
Democrats who warned white voters of the political and social chaos that would accompany a
return of black rule. By 1898, the Democrats had regained control of the state government; a
bloody race riot in Wilmington that year overthrew the legally elected Republican government
there; and an amendment to the state constitution in 1900 imitated procedural subterfuges
initiated by other southern states, including an understanding clause, a poll tax, and a grandfather
clause. With these measures, black political influence in eastern North Carolina plummeted.® By
1940, only 5 percent of the state’s eligible black electorate was registered, with most of these
voters residing in Piedmont jurisdictions.” The heavily-black counties of eastern North Carolina
reflected the racial exclusion patterns of the lower South in the same way that their economies
resembled the rural, white-elite-dominated jurisdictions of the Black Belt in Georgia, Alabama,
Mississippi, and Louisiana.
In 1944, the U.S. Supreme Court decision in Smith v. Allwright outlawed the white primary in
the South and generated renewed interest in voter registration among African Americans
throughout the region. Negro Voters’ Leagues emerged in the urban South to register blacks; in
addition, returning black war veterans refused to acquiesce in a Jim Crow society and viewed the
ballot as the shortest and surest access to full participation in southern life.* The combination of
these forces contributed to substantial increases in black voter registration, especially in the
urban Piedmont. By 1960, for example, 62 percent of Durham’s eligible black population and 54
percent of Winston-Salem’s blacks were registered to vote. But counties in the eastern part of
North Carolina lagged behind the trend. In majority-black counties (all located in eastern North
Carolina), fewer than 20 percent of the black population was registered to vote in 1960. And,
when a few blacks managed to win local elections, as in Wilson in 1953 and 1955, the state
legislature altered the electoral system from district to at-large representation. The Wilson city
council reverted to its all-white composition thereafter. The state also resorted to other vote
dilution techniques during the 1950s to restrict black voter participation including prohibiting
“single-shot” voting in fourteen counties in the eastern part of the state.’
In 1965, the federal Voting Rights Act ended black disfranchisement in the South and
rendered vote dilution tactics considerably more difficult to implement. The Act applied to 40 of
North Carolina’s 100 counties, including all of the counties in the old Black Second where the
most serious instances of disfranchisement and dilution had occurred prior to 1965. But the
legacy of vote dilution and disfranchisement proved difficult to overcome. Black voter
registration in eastern North Carolina hovered around 50 percent of eligible black voters by
1976, compared with roughly 65 percent for black voters in other parts of the state.’ In addition,
redistricting in the early 1970s and 1980s, though it enhanced the chances of black candidates,
ultimately failed those candidates who fell victim to the most racially-polarized voting in the
state.’
The addition of white and relatively-liberal Orange County to the Second District in 1971
proved insufficient to enable black Chapel Hill mayor Howard Lee to unseat incumbent
conservative Democratic Congressman L.H. Fountain in the 1972 Democratic primary. The
Raleigh News & Observer noted that the balloting “generally was along racial lines.” In 1981,
after the U.S. Department of Justice rejected a congressional redistricting plan that protected
Congressman Fountain by excluding Durham County from the Second District, conditions were
even more favorable for a black candidate. But, as one political pundit noted, “Get a black
candidate against a white in a runoff primary in rural Eastern North Carolina and the white will
win every time.” The analysis was correct as the black candidate lost, receiving only 13.1
percent of the white vote." After another unsuccessful challenge by a black candidate in 1984,
no black candidate emerged until a decade later when the legislature created a black-majority
district that enabled black candidates to compete more effectively in the new district.
The efforts to limit or exclude black political participation during the twentieth century in
eastern North Carolina and within the boundaries of the old Black Second and the new First
Congressional District, paralleled other discriminatory tactics followed by white lawmakers at
the local level. Service levels in black neighborhoods in the towns within the Black Second
remained rudimentary at best. Paved streets, regular trash pick-up, water and sewer facilities,
police protection, and educational facilities in black areas lagged behind those in white areas.
Blacks were invisible as participants in the broader community life; they were primarily a rural
manual labor force. Local papers up through the 1960s scarcely mentioned blacks outside of
criminal activities.
When the civil rights movement exposed conditions in these communities, disruption and
violence occasionally resulted. Beginning in 1959, black parents in the counties of the old Black
Second organized protests against deteriorating school facilities, inadequate textbooks, and the
absence of laboratories, recreational facilities, and libraries. Boycotts occurred in Greene County
in 1959, Northampton County in 1961, Warren County in 1961, and Granville and Martin
Counties in 1963. In addition, parents complained about the “harvest recess” that required black
schools (and only black schools) to open in early August so they could close in September for the
students to work in the tobacco and cotton fields. Such boycotts did not occur in other parts of
North Carolina.”
Black protesters occasionally met violence. Craven County in the 1960s registered more Ku
Klux Klan activity than any other county in the state. When Martin Luther King Jr.’s Southern
Christian Leadership Conference (SCLC) scoured the South in 1964 for an appropriate location
to begin its voting rights drive, SCLC leaders narrowed the choice to two particularly-egregious
violators of black civil rights, Selma, Alabama and Williamston, North Carolina (in Martin
County). The SCLC chose Selma, of course, but the fact that King and his colleagues considered
Martin County as notorious as the Alabama Black Belt reflected the status of race relations in the
old Black Second during the 1960s."
A Community of Interest
The tragedy of the old Black Second and its successors is that black and white citizens of the
District share a considerably greater community of interest than their historic antagonism would
indicate. While a few white landowners have controlled economic and political power in the
counties of the old Black Second since the eighteenth century, other whites and blacks have
shared the poverty of subsistence agriculture and, more recently, of low-wage industry.
The long economic decline in eastern North Carolina set in during the early nineteenth
century as tired farmlands could no longer compete economically with new territory opening up
in the Old Southwest (Alabama and Mississippi), and the chronically-poor transportation system
kept marketing costs high. Significant out-migration occurred, with perhaps as many as one-
third of the white population of eastern North Carolina leaving the state between 1800 and 1840.
A glimmer of hope appeared during the 1850s, however, with the emergence of the prosperous
cash crop of bright leaf tobacco in Halifax, Granville, and Warren counties along the Virginia
border. Also, a railroad-building campaign, begun in the 1840s, improved the state’s wretched
transportation system. But the Civil War intervened before the railroads could have a significant
economic impact on eastern North Carolina."
Eastern North Carolina bore the physical brunt of the war, and recovery was slow. With a
large black population and with tobacco and cotton the only universally-recognized cash
commodities in the area, agriculture and a rural lifestyle predicated on racial and class hierarchies
became more entrenched than ever. When crop prices plunged in the 1880s and 1890s, white
farmers who had relatively small holdings began to lose their lands and slide into tenantry or,
worse, sharecropping. Except for a few large landholders, poverty characterized this area of the
state by 1900."
But some economic change occurred by the turn of the century. First, as racial and economic
conditions worsened, blacks began to leave the counties of the Black Second for northern cities
or, more likely, for the lumber mills of Mississippi and Louisiana. Also, spurred by the
entrepreneurial activities of James B. Duke and R. J. Reynolds, tobacco cultivation underwent a
rebirth and it brought a measure of prosperity to Kinston, Wilson, and Goldsboro. Even so, no
town in the Black Second exceeded 10,000 in population by 1900; New Bern came closest with
9,000 inhabitants.” And, despite the advance of tobacco and the introduction of peanut
cultivation, cotton still dominated the counties of the Black Second, and its economy resembled
more that of the Old South than the New South that was emerging in the Piedmont.
The district remained poor and overwhelmingly agricultural and rural through World War II.
Drawn by non-union labor, a surplus of farm workers, cheap land, and a supportive local
10
leadership, industries began to move into the counties of the old Black Second during the 1950s
and after. DuPont’s Dacron plant opened in Kinston, for example, in 1953 and, by 1962, it
employed 2,000 people and promoted the development of Lenoir Community College. Despite
this success, Kinston’s population actually declined by 10 percent during the 1960s as talented
young people, unwilling to settle for low industrial wages, moved to the Piedmont or out of the
state altogether. In 1860, Kinston, Wilson, Greenville, and Goldsboro had been among the ten
most populous towns in the state; a century later none of these communities remained in the top
ten.
But even if the overall economic picture of the counties included in the new First
Congressional District did not change significantly during the two decades after World War II,
major transitions occurred for many of the District’s residents. The entrance of DuPont was the
first of numerous industrial enterprises to make their home in the District. These industries did
not promote urbanization; most were located in rural areas where cheap and abundant land
remained a key attraction. In fact, most residents of the new Congressional District today no
longer look to the towns for shopping, work, or entertainment.’
The industrialization of the Coastal Plain owed a great deal to a vigorous road-building
program after World War II. In 1949 only 5,109 of 52,000 miles of secondary roads were paved.
Governor Kerr Scott vowed to “get the farmers out of the mud” and significantly expanded the
state’s highway network. The primary result of this expansion in eastern North Carolina and,
more particularly in the counties that comprise the new First Congressional District, was to
improve employers’ access to surplus farm labor. The road system facilitated commuting
throughout the District.”
The new generation that grew up in the 1960s and later, forsook farm work for jobs in the
factories. The salaries were not great, but they were dependable, at least for a time. But these
industries did not raise skill levels significantly, nor did the community colleges that trained
many of these workers prepare them well for jobs in the growing Piedmont, especially in the
nearby Triangle area. On the other hand, public work enabled some of these families to retain
their farms. Commuting throughout the district from farm to factory along such routes as 117 or
Interstate-95 became common by the 1970s.2 The interstate, which was hailed as a generator of
economic development, has not turned out that way, at least not to the extent that Interstate-85
through the Piedmont has attracted a diverse mix of international firms.
Industrialization also proved insufficient to bolster a weak agricultural economy, a poor
public educational system, and a legacy of racial polarization. By 1980, Halifax County had the
highest poverty rate in the state. The chicken-processing plants and the electrical-appliance and
furniture factories have neither absorbed the surplus rural labor force or boosted consumer
income sufficiently to generate other enterprises. In November 1982, when Perdue Farms
advertised for 200 workers for its new chicken-processing plant in Martin County, 1,400 people
applied.”
Beyond the District’s major roads lay an Old South landscape of weathered country stores and
filling stations, and housing scarcely worth the name. Perhaps the most imposing building in
Halifax County is the Department of Social Services. And, although Person, Vance, and Warren
counties (all in the new First Congressional District) are in the eastern Piedmont and not in the
Coastal Plain, they share the economic problems of the coastal counties even though they are less
than fifty miles from the Research Triangle Park.” To worsen the situation, some of the
industries that provided much-needed work in this district have closed during the past decade and
moved off-shore or elsewhere in the United States.
The picture of the new First Congressional District is acutely different from the image of a
prosperous, egalitarian North Carolina. These counties and towns are the shadows in the state’s
Sunbelt economy. They form an economic twilight zone combining a declining agricultural
economy with an unstable industrial sector; an area characterized more by the farm and the small
town than by cities; a place where few newcomers enter and many residents leave.
Conclusion
The District’s counties have, historically, held the majority of the state’s black population and
they have experienced the greatest racial discrimination with respect to voting rights. Black
residents of this area were subject to wholesale disfranchisement in the early decades of the
twentieth century and numerous attempts at vote dilution since the end of World War II. The
significant degree of racial polarization in voting compounds the voting rights issue in the
District.
The historical record demonstrates a consistent pattern of voting rights exclusion and dilution
with respect to black voting power in the jurisdictions included in the new First Congressional
District. The redrawn District provides a modest protection of voting rights that blacks both
deserve and require in this part of North Carolina. With black voter registration at 44.89 percent
of the total, it is by no means certain, given the history of racial voting in the counties within the
new district, that a black candidate for Congress will be elected. But, perhaps with a more
competitive situation, it may be possible to reduce the degree of polarization and enable black
and white citizens to stress their common economic problems rather than their racial differences.
14
NOTES
1. For a detailed discussion of the Black Second and its importance to African Americans in
eastern North Carolina, see Eric Anderson, Race and Politics in North Carolina, 1872-1901: The
Black Second (Baton Rouge: Louisiana State University Press, 1981); Jeffrey Crow, ef al., 4
History of African Americans in North Carolina (Raleigh: Division of Archives and History,
1992), pp. 109-118.
2. William R. Keech and Michael P. Sistrom, “North Carolina,” in Chandler Davidson and
Berard Grofman, eds., Quiet Revolution in the South: The Impact of the Voting Rights Act,
1965-1990 (Princeton: Princeton University Press, 1994), p. 156.
3. David Goldfield, “History,” in Douglas M. Orr and Alfred W. Stuart, eds., North Carolina
Atlas (Chapel Hill: University of North Carolina Press, to be published 1999).
4. Raleigh Daily State Chronicle, March 7, 1891.
5. Anderson, Black Second, p. 145; Keech and Sistrom, “North Carolina,” pp. 155-56.
6. Crow, et al., African Americans in North Carolina, pp. 115-17.
7. Keech and Sistrom, “North Carolina,” p. 159.
8. David Goldfield, Black, White, and Southern: Race Relations and Southern Culture, 1940 to
the Present (Baton Rouge: Louisiana State University Press, 1990), pp. 46-47.
9. Keech and Sistrom, “North Carolina,” p. 160.
10. Ibid, p. 161.
11. See Richard L. Engstrom, “Racial Differences in Candidate Preferences in North Carolina
Elections,” filed as an exhibit in the Shaw v. Hunt case, n.d.
12. Quoted in J. Morgan Kousser, “After 120 Years: Redistricting and Racial Discrimination in
North Carolina,” filed as a report for Shaw v. Hunt case, March 22, 1994, p. 33.
13. Quoted in ibid. p. 49.
14. Ibid. p. 50.
15. School conditions and boycotts are discussed in David S. Cecelski, Along Freedom Road:
Hyde County, North Carolina and the Fate of Black Schools in the South (Chapel Hill:
University of North Carolina Press, 1994), p. 28.
16. Ibid., p. 85.
17. Goldfield, “History”; William S. Powell, North Carolina Through Four Centuries (Chapel
Hill: University of North Carolina Press, 1989), p. 311.
18. Goldfield, “History.”
19. Anderson, Black Second, p. 11.
20. Thomas Parramore, Express Lanes & Country Roads: The Way We Lived in North Carolina,
1920-1970 (Chapel Hill: University of North Carolina Press, 1983), pp. 55-56.
21. Linda Flowers, Throwed Away: Failures of Progress in Eastern North Carolina (Knoxville,
TN: University of Tennessee Press, 1990), p. 181.
22. Alfred W. Stuart, “The Demographic and Economic Context of the First and Twelfth
Congressional Districts of North Carolina,” filed as a report for Shaw v. Hunt case, December 7,
1993. p. 11.
23. Flowers, Throwed Away, pp. 103-04, 111.
24. Ibid., pp. 4, 168, 182.
25. Paul Luebke, Tar Heel Politics: Myths and Realities (Chapel Hill: University of North
Carolina Press, 1990), p. 67.
RESUME
DAVID REED GOLDFIELD
History Department
UNC-Charlotte
Charlotte, NC 28223
(704) 547-2184 - office
(704) 364-5377 - home
(704) 547-2729 - Fax
e-mail: drgoldfi@email.uncc.edu
EDUCATION
Ph.D. University of Maryland, 1970 (History)
M.A. University of Maryland, 1968 (History)
B.A. (cum laude) Brooklyn College of CUNY, 1965 (Political Science)
TEACHING AND RESEARCH FIELDS
The American South
Urban History
POSITION
Robert Lee Bailey Professor of History, UNC-Charlotte (since 1982)
AWARDS
Fulbright-Hays Senior Lectureship, Art History Institute, Stockholm University, Sweden, 1979
Mayflower Cup Award for Non-Fiction, 1983
United States Information Agency, Academic Specialist Award for the People's Republic of China, Fall
1987
First Citizens Bank Scholar of the Year Award, 1988
Mayflower Cup Award for Non-Fiction, 1990
Choice magazine selection, Outstanding Academic Book of 1990
Gustavus Myers Center for the Study of Human Rights in the U.S. Outstanding Book Award, 1991
United States Information Agency, Academic Specialist Award for Australia, Summer 1991
United States Information Agency, Program Grant, Japan, Fall 1992
Goldfield 2
PUBLICATIONS
Books:
Co-edited, THE ENDURING GHETTO: SOURCES AND READINGS (Lippincott, 1973)
Co-authored and co-edited, THE CITY IN SOUTHERN HISTORY: THE GROWTH OF URBAN
CIVILIZATION IN THE SOUTH (Kennikat Press, 1976)
URBAN GROWTH IN THE AGE OF SECTIONALISM: VIRGINIA, 1847-1861 (LSU Press, 1977)
Co-authored, URBAN AMERICA: FROM DOWNTOWN TO NO TOWN (Houghton Mifflin, 1979).
Second Edition, URBAN AMERICA: A HISTORY (Houghton Mifflin, 1990)
COTTONFIELDS AND SKYSCRAPERS: SOUTHERN CITY AND REGION, 1607-1980 (LSU
Press, 1982). Recipient of 1983 Mayflower Award. Paperback edition (Johns Hopkins University
Press, 1989)
PROMISED LAND: THE SOUTH SINCE 1945 (Harlan Davidson, 1987). Translated into Japanese,
1995
BLACK, WHITE, AND SOUTHERN: RACE RELATIONS AND SOUTHERN CULTURE (LSU
Press, 1990). Recipient of 1990 Mayflower Award. Paperback edition (LSU Press, 1991)
Co-edited, MAJOR PROBLEMS IN THE HISTORY OF THE AMERICAN SOUTH, 2 volumes (DC
Heath, 1990)
Co-authored, THE SOUTH FOR NEW SOUTHERNERS (Chapel Hill: University of North Carolina
Press, 1991)
RACE, REGION, AND CITIES: INTERPRETING THE URBAN SOUTH (LSU Press, 1997)
Co-authored, THE AMERICAN JOURNEY: A HISTORY OF THE UNITED STATES (Prentice Hall,
1997)
Articles:
"Disease and Urban Image: Norfolk's Yellow Fever Epidemic of 1855," VIRGINIA CAVALCADE
(Fall 1973)
"The City as Artifact: The Physical City as a Teaching Tool," HISTORY TEACHER (August 1975)
"Historic Planning and Redevelopment in Minneapolis," JOURNAL OF THE AMERICAN
INSTITUTE OF PLANNERS (January 1976)
"The Limits of Suburban Growth," URBAN AFFAIRS QUARTERLY (September 1976)
Goldfield 3
"The Business of Health Planning: Disease Prevention in the Old South," JOURNAL OF SOUTHERN
HISTORY (November 1976); reprinted in Howard Chudacoff, ed. MAJOR PROBLEMS IN THE
HISTORY OF THE AMERICAN SOUTH (Lexington, Mass.: DC Heath, 1993)
"The Black Ghetto: A Tragic Sameness.”" JOURNAL OF URBAN HISTORY (May 1977)
"The Suburbs Have Fallen From Eden," THE WASHINGTON POST (August 23, 1977)
"The Neighborhood: Islands in the Urban Mainstream," SOUTH ATLANTIC URBAN STUDIES
(August 1979)
"Suburban Development in Stockholm and the United States: A Comparison of Form and Function,"
in Thomas Hall, ed., THE GROWTH AND TRANSFORMATION OF THE MODERN CITY
(Academe Press, Stockholm, 1979)
"Amerikansk arkitektur och planering." ARKITEKTTIDNINGEN October 1979
"Planning for Urban Growth in the Old South," in Anthony Sutcliffe,
ed., THE RISE OF MODERN URBAN PLANNING, 1800-1914 (Mansell, London, 1980)
"Private Neighborhood Redevelopment and Displacement in Washington, D.C." URBAN AFFAIRS
QUARTERLY (June 1980); reprinted in Ray C. Rist, ed., POLICY STUDIES REVIEW ANNUAL,
vol. 6, 1985 (Sage, 1982)
"Squatting on Europe's Urban Frontier,” CHRISTIAN SCIENCE MONITOR, September 22, 1980.
"Preserving the Cities for Whom?" THE NEW YORK TIMES, November 4, 1980
"The Urban South: A Regional Framework," AMERICAN HISTORICAL REVIEW (December
1981)
"Svensk stad and American Urban History," in Ingrid Hammarstrom and Thomas Hall, eds.,
PERSPEKTIV PA SVENSK STAD (Malmo, 1981)
"National Urban Policy in Sweden," JOURNAL OF THE AMERICAN PLANNING ASSOCIATION
(Winter 1982)
"Renewing Europe's Inner Cities," TRANSATLANTIC PERSPECTIVES (1982)
"Svenska fororter de basta i internationell jamforelse," ATT BO (1982)
"Residential Land Vital in Cities," CHARLOTTE OBSERVER, November 4, 1982
"Urban Growth in the South," in Alexander B. Callow, Jr., ed. AMERICAN URBAN HISTORY; AN
INTERPRETIVE READER WITH COMMENTARIES (Oxford Univ. Press, 1982)
Goldfield 4
"A Metropolitan Vision: Planning and Social Equity in Sweden and the United States." HUMAN
ENVIRONMENT IN SWEDEN (December 1982)
"Approaches to Urban History," NETWORK NEWS EXCHANGE (Spring 1983)
"The New Regionalism," JOURNAL OF URBAN HISTORY (February 1984)
"The New Deal as a Big Deal for Southern Cities," INSTITUTE NEWS (Newsletter of the North
Carolina Institute of Applied History) (March 1984).
"Urban History Research in the United States and Sweden," in Thomas Hall, ed., STADER i
UTVECKLING (Stockholm, 1984)
"North Carolina's Early Twentieth-Century Neighborhoods and the Urbanizing South," in Catherine
W. Bishir, ed., EARLY TWENTIETH-CENTURY SUBURBS IN NORTH CAROLINA (Raleigh,
1985)
"Greensboro Sit-Ins Were Just the Beginning," GREENSBORO NEWS AND RECORD, February 10,
1985
"Urbanization and Regionalism in Europe and the American South," in James C. Cobb and Charles R.
Wilson, eds., PERSPECTIVES ON THE AMERICAN SOUTH, vol. 3 (New York, 1985)
"Metropolitan Planning in Sweden, 1890-1945: The European Context," HISTORY OF EUROPEAN
IDEAS (No. 4, 1986)
"Metropolitan Planning in the Industrial Era: Sweden and the United States," in Robert Weible, ed.,
THE WORLD OF THE INDUSTRIAL REVOLUTION: COMPARATIVE AND INTERNATIONAL
ASPECTS OF INDUSTRIALIZATION (North Andover, Massachusetts: Museum of American Textile
History, 1987)
"The Promise of Progress: Public Works and the Way We Live in North Carolina," TECHNOLOGY
AND CULTURE (January 1987)
"The Automobile and the City in the American South,," in Theo Barker, ed., THE ECONOMIC AND
SOCIOAL EFFECTS OF THE SPREAD OF MOTOR VEHICLES (London: Mansell, 1987). (Co-
authored)
"Economic Development in the South: Education, Equity, and the Quality of Life," in South Growth
Policies Board. EDUCATION, ENVIRONMENT, AND CULTURE: THE QUALITY OF LIFE IN
THE SOUTH (Research Triangle Park, NC: SGPB, 1987)
"Media, Myth and the Southern Mind," CHARLOTTE OBSERVER, April 8, 1987
"Neighborhood Preservation and Community Values in Historical Perspective,” in I. Altman and A
Wandersman, eds., NEIGHBORHOODS AND COMMUNITY ENVIRONMENTS (NY: Plenum,
1987)
Goldfield
"The Future of the Metropolitan Region," in Daniel Schaffer, ed., PRINCIPLES AND POLICY:
URBAN PLANNING IN THE UNITED STATES (London: Mansell, 1987)
"Communities and Regions: The Diverse Cultures of Virginia," VIRGINIA MAGAZINE OF
HISTORY AND BIOGRAPHY (October, 1987)
"Toward a Two-Party South," in Marilyn Chelstrom, ed., POLITICAL PARTIES, TWO-PARTY
GOVERNMENT, AND DEMOCRACY IN THE UNITED STATES (New York: Taft Institute, 1988)
"Epilogue: The Vanishing Sunbelt," (co-authored) in Raymond A. Mohl, ed., SEARCHING FOR THE
SUNBELT (Knoxville: University of Tennessee Press, 1989)
Essays on "Urban Planning;" "Charlotte;" "Urban Boosterism and Civic Consciousness;" "Pollution
Problems;" and "The Urban Poor;" for William Ferris and Charles R. Wilson, eds., THE
ENCYCLOPEDIA OF SOUTHERN CULTURE (Chapel Hill: University of North Carolina Press,
1989)
"Cities Rising from the Fields," TAR HEEL JUNIOR HISTORIAN (April 1990)
"The Stages of American Urbanization," MAGAZINE OF HISTORY (June 1990)
"The City as Southern History," in Howard L. Preston, ed., THE FUTURE SOUTH: AN
HISTORICAL PERSPECTIVE FOR THE 21ST CENTURY (Urbana: University of Illinois Press,
1991)
"Black Political Power and Public Policy in the Urban South," in Arnold R. Hirsch and Raymond A.
Mohl, eds. URBAN POLICY IN TWENTIETH-CENTURY AMERICA (New Brunswick: Rutgers
University Press, 1992)
"Black Life in Old South Cities," in Edward Campbell, ed. BEFORE FREEDOM CAME
(Charlottesville: University Press of Virginia, 1992)
"The South," in Stanley I. Kutler, ed. ENCYCLOPEDIA OF THE U.S. IN THE TWENTIETH
CENTURY (NY: Simon & Schuster, 1993)
"Searching for Charlotte," RECKON: THE MAGAZINE OF SOUTHERN CULTURE (premier issue,
1995)
"Southern Urban Landscapes and the South: From Boondock to Buckhead," in Walter B. Edgar, ed.
SOUTHERN LANDSCAPES (Columbia, SC: University of South Carolina Press, forthcoming)
Essays on "Charlotte," and "The Civil Rights Movement," in Robert Ferrell and Joan Hoff, eds
DICTIONARY OF AMERICAN HISTORY (NY: Scribner's & Sons, 1995)
" Antebellum Washington in Context: The Pursuit of Prosperity and Identity," in Howard Gillette and
Kym Rice, eds. SOUTHERN CITY, NATIONAL AMBITION: THE IMPACT OF URBANIZATION
ON WASHINGTON, DC, 1800-1860 (Washington, DC: George Washington University Press, 1995)
Goldfield
"Urban America in the Great Depression," (co-authored) in Andrew Lees and Lynn Hollen Lees, eds.,
THE MODERN METROPOLIS: PERCEPTIONS, PLANS, AND DEVELOPMENTS IN WESTERN
EUROPE AND AMERICA (BudaPesti Negyed, 1995)
"American Industrial and Urban Development, 1850-1920," in Walter Nugent and Halina
Parafianowicz, eds., HISTORIA STANOW ZJEDNOCZONYCH AMERYKI (Wydawnictwo
Naukowe, 1995)
"Communities of Place: Ethnic Neighborhoods in Memphis and Brooklyn," in Diane U. Eisenberg,
ed., EXPLORING AMERICA'S COMMUNITIES: IN QUEST OF COMMON GROUND
(Washington, DC: American Association of Community Colleges, 1995)
"Buried history: Into the future without a map," CHARLOTTE OBSERVER, January 23, 1996
"What is the origin of the black underclass?" CHARLOTTE OBSERVER, February 27, 1996
"America Returns to the City of the Heart," CHARLOTTE OBSERVER, March 26, 1996
"Weighing the future of integrated schools,” CHARLOTTE OBSERVER, April 23, 1996
"Colvard won a battle in war against racism,” CHARLOTTE OBSERVER, May 28, 1996
"New flame comes to a city that rose from ashes,” CHARLOTTE OBSERVER, June 25, 1996
"Immigrants add new spice to the South's population pot," CHARLOTTE OBSERVER, July 23, 1996
"What could be closer than G-O-D and G-O-P?" CHARLOTTE OBSERVER, August 27, 1996
"The name may change, but the family endures," CHARLOTTE OBSERVER, September 24, 1996
"'My only regret is that we have lost',"” CHARLOTTE OBSERVER, October 22, 1996
"Velcro approach to redevelopment can't remake a city," CHARLOTTE OBSERVER, November 26,
1996
"What awaits Charlotte in the new year?" CHARLOTTE OBSERVER, December 24, 1996
“Southern Urban Landscapes and the South: From Boondock to Buckhead,” in Tony Badger, er al.
eds, SOUTHERN LANDSCAPES (Frankfurt, Germany: Stauffenburg Verlag, 1997).
"King's discomforting theology," CHARLOTTE OBSERVER, January 20, 1997
"Southern Cities," in Neil Larry Shumsky, ed. AMERICAN CITIES AND SUBURBS: AN
ENCYCLOPEDIA (New York: Garland, 1997)
"A Sense of Place: Jews and Other Southerners," SOUTHERN CULTURES (March 1997)
Goldfield
“The Urban Crusade: Race, Culture and Power in the American South since 1945,”
AMERIKASTUDIEN, 42 (Number 2, 1997).
PRESENTATIONS
Professional Meetings:
"Urban Imperialism in the Antebellum South: Richmond, 1851-61," Southern Historical Association
Convention, Houston, Nov. 1971
"Friends and Neighbors: Urban-Rural Relations in Antebellum Virginia," Southern Historical
Association Convention, Atlanta, Nov. 1973
Directed Urban History Teaching Workshop at Organization of American Historians Convention,
Denver, Apr. 1974
Commentator, "Law and Order in the Urban South," Conference on the Urban South, Norfolk, Feb.
1975
Public/Private Cooperation in Redeveloping Minneapolis," American Institute of Planners Convention,
San Antonio, Oct. 1975
Moderator, "Housing in Urban Ghettos," Conference on the Urban South, Norfolk, Feb. 1976
"A Guide to Neighborhood Preservation," CUIUA (Urban Affairs) Conference, New Orleans, Mar.
1977
Commentator, "Society and Social Conflict in the Antebellum South," Conference on the Urban South,
Charleston, SC, Mar. 1977 :
Moderator and Panelist, "The City in Southern History: A Comparative View," Organization of
American Historians Convention, Atlanta, Apr. 1977
Commentator, "Planning History: What the Planning Past Can Tell Us About the Present,” American
Institute of Planners Convention, Kansas City, Oct. 1977
Commentator, "Planning and Administration in the New South," Conference on the Urban South,
Norfolk, Feb. 1978
"The Metropolitan Future of the National Capital Area," CUIUA (Urban Affairs) Conference, Denver;
and convenor of session on "The Future of Metropolitan Growth: A Policy Perspective," Mar. 1978
Convenor and Commentator, "City Planning and Urban Growth in the New South," Charleston, SC,
Apr. 1978
Goldfield 8
Moderator and Panelist, "The Use and Limitations of Planning History in the Classroom," American
Institute of Planners Convention, New Orleans, Sept. 1978
Panelist, "Neighborhood Organizations," Association of Voluntary Action Scholars Conference,
Toronto, Oct. 1978
Commentator, "Urbanization and Southern Culture," Southern Historical Association Convention, St.
Louis, Nov. 1978
Moderator, "Planning History: A Comparative Historiographical Frontier," American Historical
Association Convention, Washington, D.C., Dec. 1980
"Southern City and Region," Conference on the South, Charleston, SC, Apr. 1981
"The Historian as Public Servant," Third Annual Conference on Public History, Raleigh, Apr. 1981
"Urbanization in Europe and the American South: History and Regionalism," Southern Historical
Association Convention, Louisville, Nov. 1981
Moderator, "The Search for Southern Identity," Southern Historical Association Convention, Memphis,
Nov. 1982
Commentator, "Urban Politics and Municipal Government in the Mid-Nineteenth Century,”
Organization of American Historians Convention, Cincinnati, Apr. 1983
Commentator, "Immigrants and Cities in the Old South," Southern Historical Association Convention,
Charleston, SC, Nov. 1983
Moderator, "Urban History and Public Policy," American Historical Association Convention, San
Francisco, Dec. 1983
Commentator, "The Origins of Urban History: Contemporary Perspectives," Organization of American
Historians Convention, Minneapolis, Apr. 1985
Moderator and Commentator, "Houston: Problems and Promise of a Southern City," Southern
Historical Association Convention, Houston, Nov. 1985
Moderator, "Crabgrass Frontier: Is American Suburbanization Unique?" American Historical
Association Convention, NYC, Dec. 1985
Commentator, "The Social Construction of Domestic Space in the Early Twentieth Century,"
Organization of American Historians Convention, NYC, Apr. 1986
Moderator and Commentator, "Recent Research Trends in Southern Urban History," Social Science
History Association Convention, St. Louis, Oct. 1986
Goldfield 9
Commentator, "Workers, Slaves, and Authority: Free Labor in the Antebellum South," Organization of
American Historians Convention, Philadelphia, Apr. 1987
Commentator and Chair, "In Search of the 'Colored Aristocracy': Class and Community in Antebellum
Black Richmond and Philadelphia," American Studies Association Convention, Miami Beach, Oct.
1988
Commentator, "The Academy and the Museum: Two Interpretations of Afro-American History,"
National Council on Public History Convention, St. Louis, Apr. 1988
Commentator, "Race and Class in a New South City: Two Views of Charlotte, NC, 1880-1920,"
Organization of American Historians Convention, St. Louis, Apr. 1988
Moderator, "Cultural Landscapes and City Planning in Canada and the U.S.," American Studies
Association Convention, Toronto, Nov. 1989
Panelist, "The Impact of Southern History," Southern Historical Association Convention, Lexington,
Ky., Nov. 1989
"Five Stages of American Urban Development,” Urban Affairs Association Convention, Charlotte,
Apr. 1990
"Doing Comparative Urban History: Cultural Issues," Urban Affairs Association Convention,
Vancouver, B.C., April 1991
Commentator, "Old South, New South: Class Formation and Race in the Upper South," Organization
of American Historians Convention, Louisville, April 1991
Panelist, "African American Scholarly Journals: A Review," Association for the Study of Afro-
American Life and History Convention, Washington, D.C., November 1991
Moderator, "The Impact of World War II on Southern Race Relations," Southern Historical
Association Convention, Fort Worth, November 1991
Panelist, "Whose History is It? Community and Scholarly Participation in the Making of History
Exhibitions and Public Programs," Organization of American Historians Convention, Chicago, April
1992
Chair, "Racial Violence in the Twentieth-Century Urban South," American Historical Association
Convention, Washington D.C., December 1992
Chair, "Worlds Fairs and Political Aesthetics," Southern American Studies Association Convention,
New Orleans, February 1993
"Economic Development and African-American Culture on South Carolina's Sea Islands,” Nordic
Association for American Studies Conference, Odense, Denmark, August 1993
Goldfield
Moderator and Commentator, "Planning in a Regional Context," Conference on American Planning
History, Chicago, November 1993
Moderator and Commentator, "The Changing Demographics of Cities," Urban Affairs Association
Convention, New Orleans, March 1994
Moderator and Commentator, "Immigration and Sunbelt Cities: New Social and Spatial Forms," Urban
Affairs Association Convention, Portland, Ore., May 1995
Moderator and Commentator, "Immigration and Sunbelt Cities: New Social and Spatial Forms," Urban
Affairs Association convention, Portland, Ore., May 1995
"The South Comes to Brooklyn in the 1950s," Urban History Association Presidential Address, New
York City, January 1997
Invited Presentations -- Professional:
"Planning for Urban Growth in the Old South," First International Conference on the History of Urban
and Regional Planning, London, England, Sept. 1977
Directed Seminar on "Neighborhood Redevelopment and Displacement in Washington, D.C.," for
Office of Policy Research, HUD, Jan. 1978
Convenor, British Society of Architecture and Esthetics Conference, Sheffield University, England,
Apr. 1979
"Ethnic and Social Segregation: A Comparative View," Copenhagen University, May 1979
"The Role of Family and Neighborhood: A Comment," UConn-HUD Conference on the Dynamics of
Modern Industrial Cities, Storrs, Conn., Sept. 1979
"Architecture and Planning: Reflections and Choices," a series of five lectures on comparative
architecture and planning presented for the Swedish Architecture Society, Oct.-Nov. 1979; also for the
Institute of Urban Planning, Helsinki University of Technology, Finland, Feb.-Mar. 1980
"Political Attitudes Toward Suburbanization in the U.S. and Sweden," H. J. Dyos Memorial Lectures,
"The Pursuit of Urban History," Leicester, England, Aug. 1980
"Housing Subsidies in Europe," National Housing Conference, Washington, D.C., Apr. 1981
"Southern Cities: A Past for their Future," Conference on the Future of the South, Southern Growth
Policies Board, Research Triangle Park, NC, Apr. 1981
"Charlotte and the New South Urban System," Charlotte-Mecklenburg Historic Properties
Commission, May 1981
"Regional Planning in Stockholm, 1945-1980," Regional Plan Association of New York, May 1981
Goldfield
Chair, "The Process of Suburbanization," Conference on Canadian-American Urban Development,
Guelph, Ontario, Aug. 1982
"The Inner Life of the Southern City," Southern Distinctiveness Symposium, Tuscaloosa, Ala., Apr.
1983
Moderator, "Conservation and the Environment," Council for the International Exchange of Scholars
Conference, Chapel Hill, June 1983
"Urbanization of the South: The Southern Town in Time," Mississippi Chautauqua, Starkville, Miss.,
Oct. 1983
"A New Deal for Southern Cities," Federation of N.C. Historical Societies Conference, Raleigh, Nov.
1983
"Metropolitan Planning in the Industrial Era: Sweden and the U.S.," Lowell Conference on Industrial
History, Lowell, Mass., June 1984
"Recapturing Our Town: Planning and Building the Southern Metropolis," Conference on Urban
Design in the South, Charlotte, Mar. 1985
"Technology and Redevelopment in American Cities: A Historical Overview," Studienstiftung des
deutschen volkes, Salem, FRG, Aug. 1985
"The Automobile and the City in the American South, 1900-1980," XVIth International Congress of
Historical Sciences, Stuttgart, FRG, Aug. 1985
"Putting History into Historic Preservation,” Teaching Historic Preservation Conference, Stagville
Preservation Center, Durham, NC, Sept. 1985
Seminar Leader for "Health, Ethics, and Difficult Choices," Bioethics Resource Group Conference,
Charlotte, Sept. 1985
Commentator, "The Sunbelt in the American Scene;" Commentator, "Summary and Proposed Research
Agendas; " Moderator, "Cities and Suburbs," Conference on the Sunbelt: A Region and Regionalism in
the Making? Miami, Nov. 1985
"The Urban South and the Challenge of Prosperity," Somers Memorial Lecture, Georgia State
University, Atlanta, Nov. 1985
"Regionalism as Urban History," The City Seminar, Columbia University, Mar. 1986
"The Urban South: Past and Future of a Middle Landscape," Municipal Association of South Carolina
Convention, Hilton Head, SC, July 1986
"The Impact of the Space Program on Texas and the South," Conference on Space and the Human
Dilemma, Houston, July 1986
Goldfield 12
"Regionalism and Southern History," Distinguished Lecturer Series, University of Guelph, Ontario,
Feb. 1987
"The City as Artifact," Preservation Alliance of Virginia's Heritage Education Workshop, Staunton,
Va., July 1987
"Race and Economy: The South's Unfinished Agenda," Interfaith Conference, Little Switzerland, NC
Aug. 1987
"Urbanization and Modernization," lecture series at Sichuan University, Chengdu, P.R.C., sponsored
by the USIA, Sept.-Oct. 1987
"Urbanization and Regionalism," Urban History Seminar, Chicago Historical Society, Chicago, Mar.
1988
"The City as Southern History," Converse College Centennial, Spartanburg, SC, Oct. 1988
"Race Relations and Southern Culture," The Aspen Institute, Charlotte, Nov. 1988
"Black Political Power and Public Policy in the Urban South," University of New Orleans, March 1990
"The Cultural Dominance of the Northeastern Port Cities of the USA," 17th International Congress of
Historical Sciences, Madrid, Aug. 1990
Moderator, "How Do We Communicate What We Know?" Modes of Inquiry for American City
History Conference, Chicago, Oct. 1990
Panelist, "City Museums as Historians," Venues of Inquiry for American City History Conference,
Chicago, Oct. 1990
"New Directions in Urban and Regional Studies in Virginia," New Directions in Virginia History
Conference, Richmond, Oct. 1990
"Recent Research Trends in American Urban History," Urban History Museum Seminar, Richmond,
January 1991
"Race Relations in the American South since 1945," lecture series at several Australian universities,
sponsored by the USIA, July 1991
"The Lives of Slaves and Free Blacks in Old South Cities," Museum of the Confederacy Symposium,
Richmond, October 1991
"Black Political Power in the Urban South since World War II," Memphis State University, February
1992
"Race and Culture in the American South since Gunnar Myrdal," Nordic Association of American
Studies Convention, Reykjavik, Iceland, August 1992
® »
Goldfield 13
"Reinterpreting Local Culture and History in the American South: A Regional Approach,” International
Conference on Comparative Regional Studies, Tohoku University, Sendai, Japan, September 1992
"Southern Cities Unbound and Unwound: The Urban South in World War II," Conference on the
South in World War II, University of Richmond, March 1993
"Jews in the South," seminar for the Valentine Museum, Richmond, March 1993
"The History of Voting Rights in the Civil Rights Movement," for the Taft Institute of Government
Seminar, Charlotte, June 1993
"Race Relations in the U.S. Today," seminar for the Summer Academy in American Studies,
sponsored by the Deutsche Gesellschaft fur Amerikastudien and the U.S. Information Service, Werder,
Germany, August 1993
"The Community: An Overview of the History and Development of Charlotte and Mecklenburg
County," for Charlotte Chamber of Commerce Community Leadership Program, Charlotte, August
1993
"Black and White and Shades of Gray: New Views of the South," for Southern Festival of Books,
Nashville, October 1993
Panel on "Garreau and the Critics," for Symposium on "Americans in Motion: Virginia, The South,
Mobility, and the American Dream," Virginia Historical Society, Richmond, March 1994
"A History of North Carolina," for Leadership North Carolina, Winston-Salem, January 1995, 1996,
1997
"Charlotte, City of the New, New South," for Symposium on "The Changing American City,"
National Humanities Center, Research Triangle Park, NC, April 1995
"The American South Coming of Age," and "The American City Transformed," for USIS American
Studies Conference, Bonn, Germany, May 1995
"Regional Identity and Economic Development in the American South since 1945," for German-
American Symposium on National and Regional Identity, Ludwigsburg, Germany, May 1995
"Sense of Place: Blacks and Jews in the American South," for Southern Studies Forum, Cambridge
University, England, September 1995
"Imaging the American City," for Imaging the City in the Americas: The Formation and Display of
Urban Identities circa 1910 Conference, sponsored by the Getty Foundation and the Library of
Congress, Washington, DC, September 1995
"The Charlotte Model for Sustainable Development in the U.S.," for OECD Conference on Sustainable
Urban Development, Berlin, Germany, March 1996
Goldfield 14
"How African-Americans Preserved Southern Culture after World War II," and "America's Changing
Perceptions of Race, 1946-1996," European Association for American Studies Conference, Warsaw,
Poland, March 1996
"The Urban Crusade: Race, Culture, and Power in the American South since 1945," keynote address,
German Association for American Studies, Wurzburg, Germany, June 1996
"The Role of Religion in African-American History, Politics and Culture," and "Protestant
Fundamentalism and its Role in Current Politics," Seminar on Religion in the U.S., Lambrecht/Pfalz,
Germany, sponsored by United State Information Service
"The American South Comes of Age;" "Race Relations in the South;" "Recent Trends in Race
Relations," Seminar on The South in 1996, Wolfenbuettel, Germany, sponsored by United States
Information Service
"The South as Number One Economic Region?" and "Recent Trends in Race Relations in the South,"
Seiminar on The Contemporary American South: Political, Social, and Cultural Values, Berlin,
Germany, sponsored by United States Information Service
"Failed City, Fine Capital: The Planning of Washington, D.C., 1790-1860," International History of
City Planning Conference, Thessonaliki, Greece, October 1996
"The Place of Jews in the South," South Carolina Jewish Historical Society, Charleston, SC, January
1997
Invited Presentations -- Public:
Directed workshop for Charlotte-Mecklenburg County teachers on "The New South and Twentieth-
Century Mecklenburg," Apr. 1983
"The Southern Urban Patrimony," Historical Book Club of N.C., annual meeting, Greensboro, N.C.,
Feb. 1984
Directed workshop for Charlotte-Mecklenburg County teachers on "The Black Experience in Charlotte-
Mecklenburg, 1850-1920," Charlotte, Apr. 1984
"The Antebellum Urban South: Hope of a Region," 'Is it True What They Say About Dixie"
Conference, Tennessee State Museum, Nashville, Tenn., Sept. 1984
"Neighborhood Preservation," Historic Preservation Lecture Series, Greensboro, N.C., Oct. 1984
"Urbanization in a Rural Culture," A Humanities Program for Foreign Business Leaders in the
Carolinas, Charlotte; Spartanburg, S.C., Apr. 1985
"Public Works and Urban Society: An Overview," The Promise of Progress: Public Works and the
Way We Live in N.C. An Exhibit and Public Lecture series, Charlotte, May 1985
Goldfield
Interview, "Southern Cities are Different," TOUCHSTONE, The Magazine of the Tennessee
Humanities Council, Jan. 1986
"Southern Heroes," Conference on Civil Rights in Charlotte, 1945-85, Charlotte, Feb. 1986
"The Southern City: America's New Urban Place," Look Away Dixie Program, Birmingham, Ala.,
June 1986
"The Social Context of Jewish Richmond: Personalities, Wealth, and Leadership," Free to Profess: The
First Century of Richmond Jewry, 1780-1880, program sponsored by the Valentine Museum,
Richmond, Oct. 1986
"The Future of the Small Southern Town," Seneca United Revitalization Efforts, Seneca, SC, Oct.
1986
"Race, Economy, and Culture: The Making of Modern North Carolina, 1920-80," NEH Program on
The Way We Lived in North Carolina, five cities in North Carolina, Nov. 1986-June 1987
"Black Neighborhoods in the Urban South," In Bondage and Freedom, program sponsored by the
Valentine Museum, Richmond, Aug. 1987
"Uncertain Encounters: Blacks and Jews in the Urban South," NCHC Program on "South of Hester
Street: Reflections on 300 Years of Southern Jewry," Durham, Oct. 1987
"Antebellum Richmond in the South and in the Nation," In Bondage and Freedom, program sponsored
by the Valentine Museum, Richmond, Mar. 1988
"Southern Traditions and the Quality of Life: Strategies for the Future," program on the Urban South
and the Quality of Life, University of South Carolina, Columbia, Apr. 1988
"The Civil War," presented for "Let's Talk About It," series, sponsored by Duke University,
Waynesville, NC, Apr. 1988; Goldsboro, NC, Apr. 1989; Fayetteville, NC, Oct. 1989; Wilmington,
NC, Apr. 1990; Hendersonville, NC, Oct. 1990; Salisbury, NC, Sept. 1993; Mocksville, NC, Feb.
1994
"The Transformation of Charlotte: Implications for Living, Working, and Decision-Making,"
University City Rotary Club, Charlotte, Jan. 1989
"The Confederacy in the Classroom," United Daughters of the Confederacy annual meeting, Charlotte,
Feb. 1989
"Southern Politics: Issues and Trends," Taft Institute of Government, Charlotte, June 1989; June 1990
"Race Relations in the South," USIA and Council for International Visitors, Charlotte, July 1989,
February 1990
Goldfield 16
"Challenges to Economic Development in Black America," University of South Carolina Public School
Teachers Summer Seminar Series, July 1990
"A Southern Century," IBM Technical Symposium: The Challenge of Tomorrow, Charlotte, May 1991
"Ben Tillman and the Populist Movement in South Carolina," Summer Institute for South Carolina
Teachers, University of South Carolina, July 1991
"The Civil Rights Movement: How it Happened and What it Means Today," North Carolina
Humanities Council Speakers’ Forum, Hendersonville, Elizabeth City, and Asheville, NC, February
1992; Gastonia, NC, March 1993
"Rethinking the Confederacy," North Carolina Humanities Council Speakers’ Forum, Salisbury, NC,
September 1992; Elkin, NC, March 1993
"Current and Future Directions of Race Relations in the U.S.," American Center, Nagoya, Japan,
September 1992
"The Emergence of Regional Cities in the U.S.," American Center, Fukuoka, Japan, September 1992
"The 1992 Presidential Election and the American South," American Center, Tokyo, Japan, October
1992; same presentation at Osaka, Japan, October 1992
"The Museum of the New South: Purpose and Prospect,” Museum Grand Opening, Charlotte, NC,
February 1993
"What is the New South?" series presented at the Mint Museum of Art, African-American Cultural
Center, Lake Wylie Community Center, and the Charlotte-Mecklenburg Planning Commission,
Charlotte, April-May 1994
"The Impact of World War II on the South," Museum of the New South, Charlotte, May 1995
"Martin Luther King, Jr. Today," Martin Luther King Day Celebration, Charlotte Country Day
School, January 1997
CONSULTING
Falls Church, Va. Planning Commission, 1976, historic preservation
Stockholm City Museum, 1979-80, historic preservation
City planning departments in: Copenhagen, Helsinki, London (Victoria Road district), Mainz
(Germany), Stockholm, Strasbourg, and Vienna, 1979-81, inner-city redevelopment
Council of Europe, Campaign for Urban Renaissance, 1980
Goldfield
Museum Exhibit on "Public Works and Civic Values," Charlotte, Jan.-June 1985
Hezekiah Alexander Homesite Study Committee, Charlotte, Apr.-Aug. 1986
City of Seneca, SC on downtown redevelopment, 1986
Valentine Museum, Richmond, Va., 1986-
Museum of the Confederacy, Richmond, Va., 1988-92
City Museums of Memphis, 1989-
Octagon Museum (the Museum of the American Architectural Foundation), Washington, DC, 1992-
Museum of the New South, 1992-
Museum of Science and History, Jacksonville, Florida, 1994-
National Endowment for the Humanities, Division of Museum Programs, 1989-
National Endowment for the Humanities, Division of Preservation and Access, 1993-
Waterford Foundation, 1990-
WTVI Public Television (Charlotte, NC) for documentary on Judge James McMillan, 1990-
Lamont Productions for PBS Video on public housing in the South, 1992-
Cinebar Productions, Newport News, Va, "Before Freedom Came," TV documentary, 1992-94
Central Virginia's Public Broadcasting, "' Daughters’: The Life and Times of the U.D.C.," TV
documentary, 1994-
North Carolina Rural Economic Development Center, "Transformation of a Rural State in the
Twentieth Century" workshop, 1992
NATIONAL GEOGRAPHIC MAGAZINE, feature on Carolina Piedmont, Summer 1993
THE ECONOMIST (Great Britain), special section on "A Survey of the American South," December
1994
Expert Witness, U.S. Dept. of Justice, U.S. v. ANSON COUNTY, NC, 1993-94
Expert Witness, N.C. Dept. of Justice, SHAW v. HUNT, 1993-94
Expert Witness, Seminole Co. (Florida) Public Defender's Office, STATE OF FLORIDA v. MERLE
COFIELD, 1994-95 (death penalty phase)
Goldfield 18
Expert Witness, STATE OF FLORIDA v. DANNIE BARNARD, 1996-97 (death penalty phase)
Expert Witness, U.S. v. KEVIN ROZIER (Florida), 1996 (death penalty phase)
Expert Witness, STATE OF SOUTH CAROLINA v. JOSEPH SHEPPARD, 1997 (death penalty
phase)
Expert Witness, U.S. Dept. of Justice, US v. CITY OF BATON ROUGE, 1997-98
Harris Group, historical consultant for land development project, 1994-96
University of North Carolina at Wilmington, M.A. program in history, 1994-
OTHER PROFESSIONAL ACTIVITIES
Editor, JOURNAL OF URBAN HISTORY, 1990-
Associate Editor, JOURNAL OF URBAN HISTORY, 1976-90
Editorial Board, PLANNING PERSPECTIVES (Great Britain), 1983-
President, Urban History Association, 1996
Referee, AMERICAN HISTORICAL REVIEW; JOURNAL OF AMERICAN HISTORY; JOURNAL
OF THE AMERICAN PLANNING ASSOCIATION; JOURNAL OF THE EARLY REPUBLIC;
JOURNAL OF SOUTHERN HISTORY; SOCIAL SCIENCE QUARTERLY; URBAN AFFAIRS
QUARTERLY; VIRGINIA MAGAZINE OF HISTORY AND BIOGRAPHY
Referee, University of California Press; Columbia University Press; DC Heath & Co.; University of
Tlinois Press; Johns Hopkins University Press; Louisiana State University Press; University of
Missouri Press; University of North Carolina Press; Rutgers University Press; Temple University Press
Book Reviews in AGRICULTURAL HISTORY; AMERICAN HISTORICAL REVIEW; JOURNAL
OF AMERICAN HISTORY; JOURNAL OF SOUTHERN HISTORY; THE PUBLIC HISTORIAN;
TOWN PLANNING REVIEW (Great Britain); VIRGINIA MAGAZINE OF HISTORY AND
BIOGRAPHY: GEORGIA HISTORICAL QUARTERLY; NORTH CAROLINA HISTORICAL
REVIEW: SOUTH CAROLINA HISTORICAL MAGAZINE; SOUTHWESTERN HISTORICAL
QUARTERLY; FLORIDA HISTORICAL QUARTERLY; REVIEWS IN AMERICAN HISTORY;
AMERICAN JEWISH HISTORY; AMERICAN STUDIES
Board member, Commission for Education Exchange between the U.S. and Sweden, 1979-80
Fellow, Salzburg Summer Seminar, "The City in Transition," Salzburg, Austria, June 1980
Membership Committee, Southern Historical Associaiton, 1982-84
Goldfield
Education Committee, Charlotte-Mecklenburg Historic Properties Commission, 1982-1984
Project Director, "The South for Non-Southerners," South Carolina Committee for the Humanities,
Mar.-May 1985
Elected to National Humanities Faculty, January 1985
Alexis de Tocqueville Prize Committee, American Historical Association, 1989-1990
Executive Board, Urban History Association, 1989-90
Guest Editor, TAR HEEL JUNIOR HISTORIAN, issue on the Piedmont, 1990
ViceDlesiaont Board of Directors, Museum of the New South, 1991-
Executive Council, Southern Historical Association, 1991-94
Membership Committee, Organization of American Historians, 1995-
President, Urban History Association, 1996-97
Mentor, McNair Scholarship Program for Minorities, 1994-
Columnist, CHARLOTTE OBSERVER, 1996
S
V
O
I
I
L
V
I
S
-
T
V
2
a
3
7
0
A
0
3
H
La3a
0150-222-008-1
"OO
A
UNITED STATES DISTRICT COURT
EASTERN DISTRICT OF NORTH CAROLINA
Eastern Division
Civil Action No. 04-CV-104-BO(3)
MARTIN CROMARTIE, et al.
JAMES B. HUNT, JR. in his
|
|
Vv. | AFFIDAVIT OF DAVID W. PETERSON, PHD
|
|
capacity as Governor, et al. |
DAVID W. PETERSON, PHD, being duly sworn, deposes and declares the following:
Identity
1. Iam president of PRI Associates, Incorporated, a company whose chief activity is
providing statistical litigation support. I am also recently retired as Adjunct Professor in the
Institute of Statistics and Decision Sciences at Duke University, Durham, North Carolina, where for
more than twenty years I taught courses in the theory and application of statistics. I am co-author of
a book entitled Use of Statistics in Equal Employment Opportunity Litigation, the guest editor of a
special issue of the journal Law and Contemporary Problems devoted to statistical inference in
litigation, and the contributor of a chapter to each of two other books on the use of statistics in
litigation. I have testified as an expert statistical witness in more than thirty cases in federal district
courts around the nation, including the Eastern District of North Carolina, and worked with legal
teams as a statistical expert in more than two hundred different cases. I have testified for and
advised defendants as well as plaintiffs.
Assignment
2. I am retained in this matter by the defendant to examine the statistical relationship
between the boundary of North Carolina’s Twelfth Congressional District as created by the North
Carolina General Assembly on March 31, 1997 and the racial and political makeup of the
residents in that District and the surrounding area. In particular, I am asked to determine the
extent to which political affiliation might explain as well as, or better than, race the boundary of
District Twelve. Most particularly, I am asked to determine whether, based on the statistical
pattern of association relating the boundary of the Twelfth District and the racial and political
makeup of nearby residents, race appears to have been the predominant factor in defining that
boundary.
Conclusions
3. Based on an examination of the data available to me, I conclude that
a. There is a substantial correlation between the path taken by the boundary of the
Twelfth district and the political preferences of the residents of the precincts touching that
boundary, the tendency being to include precincts within the District which have relatively high
Democratic party representation.
b. There is also a substantial correlation between the path taken by the boundary of the
Twelfth District and the racial composition of the residents of the precincts touching that
boundary, the tendency being to include precincts within the District which have relatively high
black representation.
c. Because the correlation found in a. is as large or larger than that found in b., it follows
that the path taken by the boundary of the Twelfth District can be attributed to political
considerations with at least as much statistical certainty as it can be attributed to racial
considerations. In other words, there is no statistical indication that race was the predominant
factor determining the border of the Twelfth District; there is at least one other explanation that
fits the data as well as or better than race, and that explanation is political identification.
d. There is a substantial correlation, precinct by precinct, between the fraction of a
precinct’s residents who are black and the fraction who favor the Democratic political party over
the Republican.
e. Among the few border precincts where the above correlation does not exist, the
boundary of the Twelfth District appears to have been drawn at least as much with the purpose of
creating a Democratic majority within the District as with creating a black majority.
f. 1 also determined that blacks constitute less than half of the residents of District
Twelve, and that people who identify more strongly with the Democratic Party than the
Republican Party constitute more than half the residents of that District. This lends further
credence to conclusions c. and e., above.
Underlying Data
4. The information on which my conclusions rest consists primarily of the computerized
data base used by the North Carolina Legislature to draw the boundaries of districts under
challenge in this lawsuit. This file permitted me to determine, precinct by precinct,
a. the number of residents therein by racial category, according to the 1990 US census,
b. the number of voting age residents therein by racial category, according to the 1990
US census,
c. the number of registered voters therein, by racial category, according to local voter
registration records,
d. the number of people who voted for each major candidate in the 1988 Court of
Appeals election,
e. the number of people who voted for each major candidate in the 1988 Lieutenant
Governor election,
f the number of people who voted for each major candidate in the 1990 Helms - Gantt
US Senatorial election, and
g. the number of registered voters by political affiliation.
I also relied on numerous maps of North Carolina supplied to me by the State, showing the
boundaries of the Districts and the identities of the precincts bordering them.
Analysis: Correlation of Race with Party Affiliation
5. Using the data file described above, I calculated for each of the North Carolina
precincts the following seven percentages:
a. the percentage of the resident population who are black,’
b. the percentage of the voting age population who are black,
c. the percentage of the registered voters who are black,
d. the percentage of the voters who voted for the Democratic candidate in the 1988 Court
of Appeals election,
e. the percentage of the voters who voted for the Democratic candidate in the 1988
Lieutenant Governor election,
f. the percentage of the voters who voted for the Democratic candidate in the 1990 Helms
- Gantt US Senate election, and
I In 69 of the State’s 100 counties, these counts can be inferred for each precinct within
the county. For the remaining 31 counties, precinct level information is not available so we used
Minor Civil Divisions instead. Of the nine counties touching or included in the Twelfth District,
only Davie County is among the 31 counties not having precinct level information.
2 Nearly all of the racial minority people living in the vicinity of the Twelfth District are
black. I have repeated all of the analyses described in this affidavit using all minorities in lieu of
blacks, and the results are identical in all material respects.
3
g. the percentage of the voters who are registered as Democrats.’
6. I then plotted each of the State’s 2217 precincts on a graph, based on its registered
voter black percentage (5c above) and its registered voter Democratic percentage (5g above).
The result is Chart 1. This chart, which looks like an inverted tornado, displays a strong
correlation between racial composition and party preference. It shows that in precincts with high
black representation, there is a correspondingly high tendency for voters to favor the Democratic
Party. In precincts with low black representation, there is much more variation in party
preference, and the fraction of registered voters favoring Democrats is substantially lower.
7. Virtually the same picture emerges when one includes in Chart 1 just the six counties
through which District Twelve runs; and the picture is again much the same when one includes
just the nine counties touched by the Twelfth District. This collection of charts is the basis for
my conclusion that there is a substantial correlation between the black representation within a
precinct and the proportion of its residents who favor the Democratic Party.
Analysis: Correlation of Boundary with Race and Political Party
8. The basic geographic unit used by the legislature in constructing districts is the
precinct. (There are some instances in which county boundaries are used, but even these are also
precinct boundaries.) To examine the correlation of the Twelfth District boundary with the race
of people living along its path, I identified each of the precincts that touch the boundary, and
divided the boundary into segments each of which separates one precinct inside the District from
the one just outside. There are 234 such segments, each of which reflects a decision made by the
legislature about the path taken by the Twelfth District border.’ For each segment, I then
determined whether the representation of blacks is greater in the inside precinct than it is in the
outside precinct, using each of the three measures 5a, 5b and 5c.
9. If, for each segment, the representation of blacks were greater in the inside precinct
than the outside precinct, then the correlation between the path taken by the border and the racial
makeup of the precincts around which it travels would be perfect. On the other hand, were only
3 In calculating each of these four party affiliation percentages, I included only people
who were identified with one of the two major parties. Hence, a precinct that by one of these
measures is “42% Democratic,” it is in the same sense “58% Republican.”
* I have created analogous charts using the other measures of racial composition and
party affiliation defined in paragraph 5, and they too do not differ materially from Chart 1.
5 Among the border precincts, three have no registered voters. These precincts touch
five boundary segments, which are necessarily excluded from correlation calculations based on
measures Sc through 5g.
de
half of the segments of this type, there would be no correlation at all between the path taken by
the border and the racial composition of the precincts it separates.® The actual results fall about
halfway between these extremes, as follows:
Black Population (5a) 79.1%
Black Voting Age Population (5b) 79.9%
Black Registered Voters (5c) 79.5%
10. It is evident from these figures that there is some positive correlation between the
path taken by the border of the Twelfth District and the racial composition of the local residents.
It is also clear that the correlation is not perfect.
11. Similarly, I noted for each of the 234 segments constituting the border of the Twelfth
District whether the representation of Democrats was greater in the inside precinct than in the
outside precinct. If 100% of the segments had this property, the border would correlate perfectly
with party preference, while if only half had the property, there would be no correlation at all.
The actual results, for each of the four party preference measures, are midway between these
extremes, as follows:
1988 Court of Appeals Election (5d) 80.8%
1988 Lt Governor Election (Se) 78.6%
1990 Helms - Gantt Election (5f) 80.8%
Registered Voters (5g) 84.3%
12. Evidently, there is some positive correlation between the path taken by the border of
the Twelfth District and the party preferences of the local residents, though the correlation is not
perfect.
13. Comparing the numerical results from paragraphs 9 and 11 above, it is apparent that
there is at least as much correlation between the border of the Twelfth District and the party
preferences of the local residents as there is between the border and the racial composition of
those residents. That is, the statistical evidence supporting party affiliation as an important
determinant of the boundary is at least as strong, and marginally stronger, than the statistical
evidence supporting race as an important determinant of the boundary of the Twelfth District.
6 If none (0%) of the segments had this property, there would once again be perfect
correlation between the boundary line and the racial makeup along its path, but in the sense that
the boundary tends to exclude blacks from the Twelfth District.
Bu
Analysis: Divergent Boundary Segments
14. As might be expected from the correlation (paragraphs 6 and 7 above) between party
affiliation and racial composition within precincts, there are many District Twelve border
segments in which not only is the representation of blacks higher in the inside precinct than in the
outside, so too is the representation of people favoring the Democratic Party. Such segments
(which I call “convergent”) support equally the proposition that
a. the motivation for the District Twelve boundary was at least in part to maximize black
representation within the District (the “Race Hypothesis”),
and the proposition that
b. the motivation was at least in part the maximization of Democratic Party affiliation
(the “Political Hypothesis”).
Clearly, convergent segments do not help us determine which of these two propositions is more
likely.
15. There is a second type of convergent segment, namely a border segment for which the
representation of blacks is greater in the outside precinct than in the inside and for which the
representation of Democrats is also greater outside than inside. For the same reason noted above,
this type of convergent segment also tells us nothing about which of the two aforementioned
propositions is the more likely.
16. Only the boundary segments which are divergent, i.e., those for which
a. the representation of blacks on the inside is greater than that on the outside and for
which the representation of Democrats is greater on the outside than on the inside
(“Type R” boundary segments),
or, alternatively, for which
b. the representation of blacks on the outside is greater and the representation of
Democrats on the inside is greater (“Type P” boundary segments),
can indicate which of the above two propositions is more likely.
17. Evidently, a Type R divergent boundary segment favors the Race Hypothesis over the
Political Hypothesis, while a Type P segment favors the Political Hypothesis over the Race
Hypothesis.
18. Depending on the measures used to determine racial representation and Democratic
party preference, a given boundary segment may or may not be divergent. I have examined all
possible combinations of the three racial measures (5a, 5b and 5c) and the four party preference
measures (5d, Se, 5f and 5g), resulting in twelve different ways to determine whether a boundary
segment is divergent.
For example, using the two measures (5c and 5g) based on registered voters, there
are 41 divergent boundary segments. Of these, 26 are of Type P, namely ones for
which the representation of blacks is greater on the outside than on the inside, yet
the representation of Democrats is greater on the inside than on the outside. The
remaining 15 divergent segments are of Type R: the representation of blacks 1s
greater on the inside than on the outside, yet the representation of Democrats 1S
greater on the outside. Evidently, the balance here tips in favor of the Political
Hypothesis by a score of 26 divergent segments to 15: it is more likely that of the
two propositions, party affiliation was the driving force rather than race.
19. Of the total of twelve such analyses,
a. seven result in a pattern of divergent boundary segments favoring the Political
Hypothesis over the Race Hypothesis, in the sense just described,
b. three result in a pattern favoring the Race Hypothesis over the Political Hypothesis,
and
c. two result in a pattern equally strong in support of both hypotheses.
It is clear from these analyses that the statistical support for the Political Hypothesis is at least as
strong as that for the Race Hypothesis, and, indeed, somewhat stronger.
20. As indicated above, some boundary segments are divergent when judged by one pair
of measures of race and party preference, but not divergent when judged by another. There are,
however, ten boundary segments that are divergent by every one of the twelve combinations of
race and party affiliation measures. Of these ten unequivocally divergent boundary segments,
a. six support the Political Hypothesis, while
b. four support the Race Hypothesis.
Again, the statistical support for the Political Hypothesis is at least as strong as that for the Race
Hypothesis, and indeed, slightly stronger.
bg
21. Finally, the representation of blacks in the Twelfth District by each of the three
measures used herein is:
Black Population (5a) 47%
Black Voting Age Population (5b) 43%
Black Registered Voters (5¢) 46%
By none of these measures do blacks constitute a majority of the people in the Twelfth District.
Similarly, the representation of Democrats in the Twelfth District by each of the four measures
used herein is:
1988 Court of Appeals Election (5d) 62%
1988 Lt Governor Election (Se) 62%
1990 Helms - Gantt Election (51) 66%
Registered Voters (5g) 75%
By every one of these measures, Democrats constitute a majority of the people in the Twelfth
District. These figures support the proposition that creation of a Democratic majority in District
Twelve was a more important consideration in its construction than was the creation of a black
majority.
Further the Affiant Saith Naught.
uid i 11 GU
David W. Peterson, PhD
\
ad ii
Subscribed and sworn to before me this £ = day of rs in . , 1908,
Lr ZL. PAI My Commission Expires: fo J RR
Notary Public
chart 1. Precinct by Precinct Plot of %Black v. % Democratic
Registered Voters, Statewide
Plot of RPCTBLK*PCTDEM. Legend: A = 1 obs, B = 2 obs, etc.
100 +
} IBA
A DHF
5 3DESB
3 A =
\0 AB
A FA AA
90 +
A
AL AA
A A A
A A
A A
AA LANEY
80 +
A 2A
A AAA FAA
AE 3A
A 8 AA
B A A
ABAB -)
70 +
A A AA A
AA A A AA 3 A
A AA A AMA
A AAA AAA ££ A
AA A AA ALTA
A AA A 88
80 +
ATTA A A AA
B AAA A A BA AAs B
AMA AB AAAA TT B
%
A A A 4 BEB
8
A A A AA AC FB B A
3
BA A A AA AAAAAA; AAAR
a 50 -
AA AA A AB AB A
c
A 8 A ACABB ABA
K
A A A AAB AA
AA AA AA A ACAAA AA A AA
CAAA A AA ABA AABABDA ~A A
ATLA ABAAA AAA A AA A
40 +
A AA A AB AA AMAA D
A AA BB A AA A AA
AA BA AA CC AB ADAA AEDABBC A AMAA AA AAA A AA BBE AADD A A
~e aaa ~ an ar - “ A
ED
1
UNITED STATES DISTRICT COURT
EASTERN DISTRICT OF NORTH CAROLINA
EASTERN DIVISION
Civil Action No. 4-96-CV-104-BO(3)
MARTIN CROMARTIE, THOMAS )
CHANDLER MUSE, and GLENNES )
DODGE WEEKS.
Plaintiffs.
AFFIDAVIT OF
v. DR. ALFRED W. STUART
JAMES B. HUNT. JR., in his official
capacity as Governor of the State of North
Carolina, et al..
Defendants.
Alfred W. Stuart, being first duly sworn, deposes and says:
lL. I am a Professor of Geography at the University of North Carolinaat Charlotte. where
I have been on the faculty since 1969. For 17 of those years I served as Chairman of the Department
of Geography and Earth Sciences. I earned a BS degree from the University of South Carolina, an
MS from Emory University and my PhD from Ohio State University.
2. My professional work has focused on economic and demographic change in the
Charlotte urban region, North Carolina and the rest of the South. This work has found primary
expression in a number of atlas-style publications. These publications were a collaborative effort
with a number of colleagues in which patterns and trends have been articulated in a substantive text
and illustrated with appropriate maps, charts and photographs. The atlas for the state of North
Carolina was published by the University of North Carolina Press in 1975. It received wide critical
acclaim and served as a model for other regional atlases that were published in Michigan, Oregon,
Georgia and other states. A revision of that book is now underway and it is expected to be published
by the UNC Press in 1999. Other atlas-style books which I have helped edit and author include a
series on the urban regions of North Carolina and a 1989 work, Land of the South, that portrayed
growth and change in the major sub-regions of the South. All of these books were prepared in such
a way as to make the information accessible to lay readers. as a means of helping them make more
informed decisions about their state and communities. A copy of my curriculum vitae is attached.
3. I was asked by representatives of the Attorney General's Office to replicate for the
1997 congressional plan an analysis I prepared in the Shaw litigation which compared the driving
times and distances of the twelve congressional districts in the 1992 plan. My analysis is contained
in this affidavit.
4. The primary means that is used by persons moving around within a congressional
district in North Carolina is the personal automobile. For this reason, one of the more significant
measures of intra-districtinteractionand information exchange is the degree of highway accessibility
from one end of a district to another. For purposes of this analysis, average driving time also was
computed since it is probably a greater concern for most people than mileage.
5. Access by highway is a function of both the size and shape of a district but especially
of the nature of the highway ty that covers it To illustrate this point, points were selected
within each district that are identifiable on a highway map and which approximate maximum
distances across the district. In several cases (Districts 1, 3 and 7) where the distance appears to be
about the same length in several directions, several pairs of points were selected. These pairs of
points were entered into a sophisticated computer model that contained a data base of the entire
2
highway network for North Carolina and also informationon the characteristics of the roads (number
of lanes. etc.) and speed limits. A TransCAD (version 2.1) software designed especially for highway
studies was used to make the analysis. The computer model chose the route or routes that
represented the minimum travel time between the selected end points. It also provided the mileage
of each selected route. These travel times and distances are summarized in Table 1 in the Appendix.
Maps included in the Appendix outline each of the routes.
6. The travel times that were calculated by the computer program reflect average driving
times in an automobile. No allowances were made for possible rush hour traffic congestion or for
stopping en route. Such factors as driving at speeds other than the legal speed limits would modify
the actual driving times. The point of these calculated times was not to estimate actual times but to
make estimates for each route on the same basis in order to provide objective figures for comparative
purposes. Small differences in times should not be taken too seriously but greater differences are
meaningful.
7. The shortest travel time and distance (1.26 hours and 64 miles) for all of the 1997
congressional districts was that calculated for the relatively compact District 9, the route for which
follows primarily I-85 and some of U.S. 74. In addition, Districts 4, 6 and 12 also have travel times
of less than two hours and distances of less than 100 miles. In contrast, District 3, on each of two
routes, has the longest paths Beconse of the sizs of the district and the nature of the road network.
The routes begin on the elongated Outer Banks and go either west or south. Representative of the
best highways through the district is U.S. 17, which is not an Interstate. Both routes are estimated
to take over four hours and are close to or more than 200 miles long. The other longest travel times
and routes are in Districts 1 and 11. The times and distances for Districts 1, 3 and 11 reflect the
-
~
relative geographic size of the districts which results from the dispersion of the population in these
more sparsely populated areas of the state.
8. Of all twelve congressional districts. District 12 has the third shortest travel time
(1.67 hours) and third shortest distance (95 miles) between its farthest points. For purposes of intra-
district interaction and information exchange, District 12 is a highly accessible district by highway
and is therefore compact in the sense of travel time and distance for a congressional representative.
9, In the Shaw litigation, I submitted a report analyzing the time and travel distances for
the districts in the 1992 congressional plan using the same computer model. The times and distances
are summarized in Table 2 in the Appendix. Also included in the Appendix is a map of these routes.
10. The average travel time for the 1992 districts was 2.65 hours, ranging from a low of
1.34 hours (District 10) to a high of 4.77 hours (District 1). The average distance for the 1992
districts was 141.1 miles, ranging from a low of 37.1 miles (District 10) to a high of 271 miles
(District 1). District 12, although only slightly above average for time and distance (2.97 hours and
162.4 miles) ranked in the bottom one-third for time and distance.
11. The average travel times and distances for the 1997 congressional districts do not
differ significantly from the 1992 districts: the average travel time remains at 2.65 hours, while the
average distance is slightly shorter at 130.6 miles. However, the travel times for District 12 have
improved dramatically, moving to a number three ranking in terms of shortest time and distance.
12. At the request of the Attorney Generals office, I did an analysis of the population
growth in North Carolina’s congressional districts. A true copy of that report is attached hereto and
incorporated by reference.
This the £3 day of February, 1998.
Sworn to and subscribed before me this
<3 day of February, 1998.
Z Notary Public y
My cotnmission expires: /2-20-99
fh TC
Alfred W. Stuart, PhD
TABLE 1
NORTH CAROLINA
CONGRESSIONAL DISTRICTS (1997)
Estimated Maximum Travel Distances Within Districts
District Destinations Time(hrs.) Distance(mi.)
1 Roxboro to Sunbury 3.02 151
1 Sunbury to Goldsboro 2.72 143
2 Johnsonville to Exit 150 on I-95 1.90 114
3 Holly Ridge to Corolla 4.97 23
3 Dobbersville to Whalebone 4.12 193
4 Carbonton to Picks 1.59 67
5 Ashland to Leasburg 3.47 173
6 Eli Whitney to Landis 1.78 98
7 Hope Mills to Southport 2.24 104
7 Rowland to Surf City 2.46 117
8 Harrisburg to Red Springs 2.36 106
9 Matthews to Boiling Springs 1.26 64
10 East Bend to Poplar 2.64 123
11 Cliffside to Oak Park 3.58 178
12 Greensboro to Charlotte 1.67 95
Note: The points chosen for each district are readily identifiable places on the NC Highway map
that approximate the greatest distances from one end of the district to the other. Several routes
were used in districts that have broad dimensions in several directions.
North Carolina Congressional District 1: Travel Time and Distance
DANMCAEVA df p83 Ah.)
A
INGHAM NC
Map Features
[ ]Counties
£2) 1997 Districts
0 10 20 30
CT e——
Miles
DUPLIN NC
North Carolina Congressional District 2: Travel Time and Distance
il a ANCE NC HERTFORD NC
LLE N
HALIFAX NC
Exit 150 from 195
UIL NC ORANGE NC FRANKLIN NC BERTIE NC pS
URHAM N
NASH NC -
EDGECOMBENC
MARTIN NC ]
N NC E NC
RANDOLPH NC HATHAM NC : ON NC
\ 1.90 hours/113.6 miles
N
JOHNSTQMWNC w
LEE NC GREENE NC N UF
HARNETT N WA
; {VONTGOMERY N MOORE NC Johnsonville
%
0
CRA C PA
MBERLAND N Map Features
one LICHMOND NC HOKE NC S Se 0 CT oounties
0 9 18 27
aaa.
COTLAND N
Miles
North Carolina Congressional District 3: Travel Time and Distance
PENDER.NC
SN
97 hours/232.5 miles
eg
Map Features
[ |Counties
2) 1997 Districts
0 10 20
Miles
30
North Carolina Congressional District 4: Travel Time and Distance
p
OCKINGHAM NC CASWELL NC ERSON NC A WARREN NC
VANCE NC
BNNULLE NC
GUILF@RD FRANKLIN NC
NASH NG
E NC “5% Ry MAKE N he oo
RANDOLPH NC CHATHAM Nd
Map Features
[ ]Counties
£2) 1997 Districts
0 5 10 15
| I. — JOHNSTON NC Miles
North Carolina Congressional District 5: Travel Time and Distance
sg FRANKLIN VA Tar ¥ 3-2
FLOYD VA q
PITTSYLVANIA VA
HALIFAX VA
VASHINGTON VA SOUTH BOSTO)
GRAYSON VA PATRICK VA
VA Per}
J
JOHNSON T
SURRY NC STOKES NC
—
WATAUGA NC
AVERY NC
2 BURKENC 7 ;
0 RANDOLPH NC
DURHAM NCR
Map Features CATAWBA NC
[Counties
E31 1997 Districts
0 9 18
EE ES
Miles LINCOLN NC
North Carolina Congressional District 6:
WILKES NC
ALEXANDER NC
CATAWBA NC
LINCOLN NC
GASTON N
Travel Time and Distance
YADKIN NC
IREDELENC
DAVIE NC
Eli
* [1.78 hours/98.1 miles |
RANDOLPH NC
ROWA
andis
CABARRUS NC
STANLY NC MONTGOMERY NC
ORANGE NC do
DURHAM NC §
Whitnhe
Tr
HATHAM NC
HARNETT NC
Map Features
[ |Counties
2) 1997 Districts
0 1 14 21
aaa
Miles
North Carolina Congressional District 7: Travel Time and Distance
va HARNETT NO \ wah
LY NC MONTGOMERY Nd
i
MOORE NC
R
RICHMOND NC
ANSON NC [ DUPLIN NC
SCOTLAND Ng
STERFIELD SC 7 roseson 1 2-24 Hours 103.7 is) 5
ARLBORO SC
PENDER NC
Rowland f
2. ” hours/116.7 miles GN
DILLON SC
FF
DARLINGTON SC
* egg
= SC Al
MARION S
FLORENCE SC
ly
3 pj Map Features
HORRY SC a PHONE a7 [ ]Counties
p04 Li 2) 1997 Districts
7% 0 10 20 30
oo
Re” =P Kh OP
Miles
North Carolina Congressional District 8: Travel Time and Distance
ZZ
(2.36 hours/105.97 miles |
SERLAND NC
HOKE NC RICHMOND NC
LANCASTER SC
Map Features CHESTERFIELD SC ROBESON NC
[ ]Counties ARLBORO SC
2) 1997 Districts
{0 6 12 18
[IE
Miles N
North Carolina Congressional District 9: Travel Time and Distance
CLEVELAND NC
Boiling Springs
py
4
NN N
CHEROKEE SC ss
GASTON NC
11.26 hours/63.3 miles \
IANA A [ah] is
CABARRUS NC
Map Features
[ ]Counties
2) 1997 Districts
0 3 6 9
EE I—
Miles
North Carolina Congressional District 10: Travel Time and Distance
GRAYSON VA
\ BRISTOL VA pt
SULLIVAN TN :
ALLEGHANY NC
JOHNSON TN
SURRY NC | STOKES NC
WASHINGTON TN CARTER TN |
2.64 hours/122.7 miles |
WILKES NC
WATAUG
EastiBend
YADKIN NC
FORSYTH
Poplar
LL NC
CALDWELL NC
ALEXANDER NC DAVIE NC
YANCEY NC
IREDELIgNC
BURKE NC
¥
MCDOWELL NC
Map Features CATAWBA NC
[Counties
2) 1997 Districts
8 12 18
[a
Miles
North Carolina Congressional District 11: Travel Time and Distance
y AVERY NC Fo
BMELL NG
CALDWELL NC
NTN
3.55 hours/178.3 miles |
RUTHERFORD NC
shall fo LEVELAND NC
RANSYLVANIA NC
BA IN
GREENVILLE Sq
r
: )
ANNE GA RABUN GA fo
p
RL
% Map Features
: OCONEE §£ [ [ ]counties
GILMER GA i =) 1997 Districts
HABERSHAM G# A : 4 —r —
1 LIMDKCIN CA ed ¥ AN ok Miles
North Carolina Congressional District 12: Travel Time and Distance
TAUGA NC
WILKES NC
ORANGE NC
DURHAM
CALDWELL NC
ALEXANDER NC
: —
IRKE NC
RANDOLPH NC
3 ’ Sy /
[1.67 hours/95.3 miles |
LINCOLN NC
HARNET]
MOORE NC
Map Features
ty
[ ]Counties
=) 1997 Districts CHEROKEE 3 oo Ny :
oh Z RICHMOND NC 0 8 16 24
YORK SC UNION NC ANSON NC ) —— E—
on \ Miles
TABLE 2
NORTH CAROLINA
CONGRESSIONAL DISTRICTS (1992)
Estimated Maximum Travel Distances Within Districts
District Destinations Time(hrs.) Distance(mi.)
1 Elizabeth City to Wilmington 4.17 207.7
1 Elizabeth City to Whiteville 4.77 271
2 Southern Pines to Rocky Mount 2.42 125.6
3 Clinton to Moyock 4.47 239
4 Wakefield to Siler City 1.34 69.5
5 Boone to Oxford 3.53 192.2
6 Salisbury to Burlington 1.47 77.1
7 Lumberton to Jacksonville as 120.2
7 Lumberton to Jacksonville (via 2.63 124.9
Wilmington)
8 Mooresville to Laurenburg 2.28 121.4
9 Belwood to Matthews 1.54 71.8
10 Valdese to Elkin 1.37 752
10 Lincolnton to North Wilkesboro 1.34 57.1
11 Murphy to Old Fort 2:35 133.3
11 Murphy to Forest City 2.87 162.7
12 Gastonia to Durham 2.97 162.4
12 Gastonia to Durham (via Statesville) 3.37 188.5
®
©
2]
(3)
(4)
(5)
6
?
®
©
(0)
e
e
©
©
®
®
LX)
ri Py (City 5 LPN qv
> Gasionia —
Ca” a » Charlot
1992
Congressional District Driving Routes
p" nt ney Moyock @
£ Ni he Winston - gn: Yad Le Fe ) Elizabeth City od
~ SE ll Salem 0 ig Bunion y a 0 A Pe ss
lp PF Lieointon
441 146 h, LS
Gel J} Belwdod [x
~ Me
wy jo
ings 0
Lp Wallet = oe. ) 85] - i a Wakefielgy ; / 7 £90 i
(114) Old Fort, O> Mooresville f Shier ity Pad Raleidh : ¥ : 0.2% EL 9, oh A : t ~
Heer
ff » Clintory Og — 74 3
District Routes = gr /
or aT, 0)
Elizabeth City - Wilmington (4.17 hrs., 207.7 miles) i
Elizabeth City - Whiteville (4.77 hrs., 271 miles)
Southern Pines - Rocky Mount (2.42 hrs., 125.6 miles)
Clinton - Moyock (4.47 hrs., 239 miles) Sih
awe, Wilmington
0 50 100 miles
|
Wakefield - Siler City (1.34 hrs., 69.3 miles)
Boone - Oxford (3.53 hrs., 192.2 miles)
Salisbury - Burlington (1.47 hrs., 77.1 miles) 0 50 100 kilometers %
Lumberton - Jacksonville (2.25 hrs., 120.2 miles)
Lumberton - Jacksonville via Wilmington (2.63 hrs., 124.9 miles)
Mooresville - Laurinburg (2.28 hrs., 121.4 miles) © starting point
Belwood - Matthews (1.54 hrs., 71.8 miles) O:. end point
Valdese - Elkin (1.37 hrs., 75.2 miles) 71 driving direction
Lincolnton - North Wilkesboro (1.34 hrs., 57.1 miles)
Murphy - Old Fort (2.35 hrs., 133.3 miles)
Murphy - Forest City (2.87 hrs., 162.7 miles)
Gastonia - Durham (2.97 hrs., 162.4 miles)
Gastonia - Durham via Statesville (3.37 hrs., 188.5 miles)
Hypothetical District: Charlotte - Wilmington (3.76 hrs., 196.3 miles)
12/16/97
POPULATION IN NORTH CAROLINA
CONGRESSIONAL DISTRICTS
by
Alfred W. Stuart
Professor of Geography
UNC Charlotte
I. STATE LEVEL CHANGE
Overview
North Carolina, with about 7.4 million residents in 1997, is the nation’s eleventh
most populous state and it 1s one of the fastest growing. Population increased by 800,000
people between 1990 and 1997, for example. In addition to growth, significant change is
occurring in the ethnic diversity, age structure and geographic distribution of population.
All of these changes bring into serious question the wisdom of modifying electoral districts
that were drawn originally by using data from the 1990 Census.
Growth Trends
Probably the single most stnking aspect of North Carolina’s recent demography is
its simple growth. Between 1980 and 1990 the state added 750 thousand people to its
population, an increase of 12.7 percent, faster growth than the national increase of 9.8
percent. The previously noted addition of 800 thousand people during the 1990-97 period
represented a 12.2 percent rate of growth, well ahead of the overall US increase rate of 7.3
percent. This suggested that not only is North Carolina growing faster than the nation as a
whole but also that the difference in growth rates is accelerating.
This status 1s the result of relatively strong growth in recent decades, with the state
rank moving up from 14th in 1920 and 12th as recently as 1970. Projections prepared by
the North Carolina Office of State Planning call for the statewide total to surpass 9.3
million people by the year 2020. The U.S. Census has identified eight states as growth
12/16/97
centers that will account for 60 percent of net population growth for the entire nation
between 1990 and 2020. These eight include Georgia, Virginia and North Carolina. This
represents quite a change from just a few decades ago when more people were leaving the
state than moving in.
In addition to growth, the state's population has become older, more urban, more
female and ethnically more diverse. However, perhaps the most distinctive aspect of
population in North Carolina is its long-standing tendency to be widely dispersed, in rural
areas, small towns and in cities of modest size. It was only in 1990 that the U.S. Census
classified a bare majority of the state's population as living in urban places. This pattern is
the basis for the perception that this is a small town/rural state even though it also is one of
the nation's most populous and one of the most highly industrialized. However, this
perception is rapidly becoming dated. The state is in the midst of an historic transition in
which this broad dispersion is giving way to a seemingly inexorable concentration of
growth in metropolitan areas, especially the larger ones. Of equally compelling significance
is the tendency for the great majority of recent and projected future growth to be due to the
migration into the state of hundreds of thousands of people. That is, most of the state’s
growth is coming from people moving in from other states and from overseas rather than
from increases in the native population.
Migration
For most of the first half of the 20th Century, more people moved out of
North Carolina than moved in as thousands of rural blacks and whites left in search of
better economic opportunities elsewhere. This process is referred as Net Out-Migration.
As a result, between 1940 and 1970, North Carolina grew more slowly than did the nation
as a whole. Overall growth occurred at all only because of high fertility rates among
women in North Carolina’s predominantly rural population. Natural Increase, growth due
to births exceeding the number of deaths, was large enough to offset losses due to out-
migration. Beginning in the 1960's this trend began to change as the state experienced a
modest Net In-Migration of whites while African Americans were still leaving by the
hundreds of thousands. At this point, the economy of the state was expanding vi gorously
12/16/97
along with the rest of the South, especially in its urban areas, but many of these jobs
initially were not available to blacks. This began to change with the dismantling of Jim
Crow laws and blacks also began to move into the state. Total out-migration slowed
between 1960 and 1970, just as birth rates were falling in line with national averages. A
sharp tumaround in migration flows occurred between 1970 and 1980 when North
Carolina had a net in-migration of over 278,000 people, including a modest number of
blacks, their first net gain through migration in modern history.
In the 1980-90 decade, in-migration swelled to over 374,000 people,
including 31,090 non-whites. As a result, since 1970, North Carolina has grown faster
than the nation. In-migration surged further between 1990 and 1996, with new residents
outnumbering those who left by a record-breaking total of 436,724 during the six year
period. These in-migrants accounted for no less than 63 percent of the state's net
population growth during that period. As Figure 1 shows, in-migration has replaced
natural increase as the principal dnver of growth and this is expected to be the case well
into the next century.
Ethnic Composition
In the early part of this century nearly one-third of North Carolina’s
population was composed of African Americans. The proportion that was white increased
to a high of almost 77 percent by 1970, reflecting the massive out-migration of blacks. In
the last two decades, the white proportion of the population remained at about 76 percent.
Meanwhile, the black proportion has fallen to about 22 percent.
The recent growth in the non-white population other than by African Americans is a
measure of North Carolina’s increasing ethnic diversity (Figure 2). This is reflected in
more languages heard on the street, restaurants specializing in different cuisines and bi-
lingual programs in schools. Once almost entirely a bi-racial population dominated by
African Americans and whites, the state has experienced a dramatic rise in other population
groups. Between 1980 and 1995 both the black and the white populations grew at rates,
20.8 and 20.7 percent, respectively, that were slower than the overall state increase of
Figure 1. Components of North Carolina Population Change, 1940 - 2020
1,000,000
800,000
Natural
Increase
600,000
400,000 Q
ed
Li
-
>,
oO
0
200,000
Net
~ Migration
- 200,000 - 400,000 “-
1940- 1950- 1960- 1970- 1980-
1950 1960 1970 1980 1990
Year
Figure 2. Composition of North Carolina Population
8 000 000 y 5s CS a:
7,000,000 §
6,000,000
5,000,000
4,000,000
3,000,000
N
u
m
b
e
r
of
Pe
op
le
2,000,000
1,000,000 i : 1 | i i
1940 1950 1960 1970 1980 1990 1995
TOTAL POPULATION
180,000
150,000 American : 0 . SRRRAR,
Indian
120,000
90,000
60,000
N
u
m
b
e
r
of
Pe
op
le
N
u
m
b
e
r
of
Pe
op
le
1970 1980 1990 1995 1980 1990 1995
OTHER NON-WHITES HISPANICS
Source: U.S. Census.
12/16/97
22.5 percent. This was because higher growth rates were recorded by several other ethnic
groups. Although Native Americans have been relatively insignificant numerically at a state
level (1.2 percent of the state population in 1995), their total rose by 39 percent between
1980 and 1995. They tend to be concentrated primarily in southeastern part of the state,
especially Robeson County, which alone contains over half of North Carolina's Native
American population.
Asians increased even more dramatically, by nearly 350 percent, between 1980 and
1995 and totaled 88,000 persons in 1995. Hispanics, of all races, grew by 75 percent
between 1980 and 1995, to over 100,000 persons and constituted nearly 1.4 percent of the
North Carolina total. One analyst estimated that by 1996 the Hispanic population may have
reached 300,000. All of these other ethnic groups, unlike Native Americans, are found
predominantly in urban areas.
This trend toward ethnic diversity 1s expected to continue into the future. U.S.
Census projections call for the Asian population to rise to over 260,000 by the year 2020
and Hispanics are projected to make up another 216,000. Whites will still be in the great
majority but their share of the state total is expected to decline to just over 72 percent and
blacks will increase their share to 23.5 percent.
Age
Like the rest of the nation, the population of North Carolina is getting progressively
older. The median age in the state, for example, has risen from 26.5 years in 1970 to 33 in
1990 and by the year 2020 it expected to reach about 39 years. The recent and future
projected increases are slightly higher than those for the nation as a whole. This increase in
age reflects greater life expectancies for older people, smaller families and the tendency for
more of population growth to be by people moving into the state and many of these
migrants are retirees.
Figure 3 shows how the age mix of the population grew between 1980 and 1997
and how it is projected to shift out to the year 2020. All age groups will increase
Figure 3. Population of North Carolina Age Groups
2,500 |
25-44 ——
» 2,000
©
ja
[4]
7p]
o 21,500
p=
S 1,000
©
=
)
0-4
1980 1990 1997 2010 2020
Age Groups
ssmsnae 65 aNd above
ems 45 - 64
25 - 44
em 19 - 24
eommu 5 - 18
emmme ) - 4
Source: U.S. Census 1980 and 1990; 1997 estimates and
projections from the N.C. Office of State Planning.
12/16/97
substantially throughout the entire period but there have been some significant variations in
this. While the pre-school ages (0-4 years) have and are expected to continue to increase in
number, those of school age (5-18 years) have been less consistent. They actually declined
between 1980 and 1990 and the estimated total for 1997 is only slightly above that recorded
in 1980. However, a sharp increase is projected between 1997 and the year 2010. These
fluctuations have major implications for school systems across the state. The college/early
working age group (19 to 24 years) declined even more sharply between 1980 and 1997,
being over 50,000 lower in 1997 than in 1980. However, by early in the next century
these numbers will rise sharply as the school-age population comes of age.
The older groups have had different trends. The younger working age group (25-
44 years) has grown steadily through 1997 but its total is expected to decline slightly the
early 21st century before slowly rising again by 2020. It is this age group that, in great
measure, has supplied the employees for the state’s robust economy but its expected
decline or slow growth raises serious questions about future labor supplies.
All of the aforementioned age groups have declined markedly in their shares of the
state’s population. and this is expected to continue into the future. The 5-18 years and 19-
24 years groups together fell from 35 percent of the total in 1980 to 27.5 percent in 1997
and they are expected to fall to 25 percent by 2020. The younger working age group, 12
percent of the statewide total in 1980, is expected to barely exceed eight percent by 2020.
The reason for the falling relative shares of younger people has been the strong
increase in the older population and these groups are expected to grow even faster in the
future. The older working age group, 45 to 64 years, has grown steadily in number even
though its statewide share declined slightly between 1980 and 1990, from 19.6 to 19.3
percent. However, the numbers in this group are projected to nearly double between 1990
and 2020 and its share of the state total rise to almost 26 percent.
The fastest growing group in the population is the elderly, 65 years and older.
Rising numbers caused its share of the state total to rise from 10.2 to 12.7 percent between
1980 and 1997 and this is expected to reach 17.7 percent by 2020. The number of people
12/16/97
65 or older is expected to double between 1990 and 2020. In 1980 there were twice as
many people aged 5 to 18 years as there were 65 or older. By 2020 the elderly will
outnumber that younger group by 50,000 people. The implications of this growth of the
elderly have enormous implications for health care, Medicare/Medicaid, other support
services, housing and many other sectors of life.
A primary reason for the rapid growth of the elderly population is that North
Carolina in recent years has become a major destination for retirees. In 1990 some 65,000
people who were 60 or older between 1985 and 1990 moved to North Carolina. This
ranked the state fifth highest in the nation, trailing only Florida, California, Arizona, and
Texas. In 1960 it ranked 27th, 17th in 1970 and 7th in 1980 in this measure. This sharp
rise led American Demographics magazine (November, 1994) to designate North Carolina
as "the rising star" among those states that have become more popular destinations for the
elderly. A major source of these retirees has been the state of New York. Some 222,000
people aged 65 or more left New York between 1985 and 1990 and nearly 9,000 of them
came to North Carolina.
Urban
Although North Carolina has long been known as a relatively under-
urbanized area, there has been a gradual increase in the proportion of the population that
lives in urban places. In 1960, only 39.5 percent of the population was classified by the
Bureau of the Census as living in urban places, at a time when the South had a comparable
proportion of almost 59 percent. By 1970 the North Carolina proportion had increased to
45 percent, and to 48 percent in 1980, while the South for those time periods was nearly
65 and 67 percent, respectively. This divergence continued into 1990, when
approximately 50.4 percent of the population in North Carolina was classified as urban
while almost 68.6 percent of the South was so classified. Only five other states (Maine,
Mississippi, South Dakota, Vermont and West Virginia) had smaller urban proportions
than North Carolina and none are as populous. Another measure of North Carolina's
"under-urbanization" is provided by a 1996 estimate prepared by the North Carolina Office
" » 12/16/97
of State Planning which shows only 49.75 percent of the total population living within the
bounds of one of the state's 529 incorporated municipalities.
Somewhat paradoxically, 66.3 percent of the state's people lived within a
federally recognized Metropolitan Statistical Area (MSA) in 1992, not far behind the
South's 74.3 percent and the national mean of 79.7 percent. This indicates that while many
North Carolinians do not live within an incorporated place, they do live close to a city,
including the outer margins of metropolitan areas. The relatively high proportion not living
in towns and the number living in unincorporated parts of MSA counties are measures of
the historic tendency for the population of North Carolina to be rather dispersed, typically
living in a rural setting and working in a near-by town.
Rural
North Carolina has long had a large rural population, a majority of its total
throughout all but its most recent history. And even though its proportion has declined in
recent decades, the rural component has increased in actual numbers, from 2.7 million in
1960 to nearly 3.3 million in 1990 (Figure 4). However, these numbers mask a substantial
restructuring within the rural population. The U.S. Census distinguishes between a rural
"farm" and a rural "non-farm" population, based on whether or not the rural population
actually lives on a working farm. The 1990 Census defined a farm as a place from which
$1,000 or more of agricultural products were sold, certainly a minimal definition. Those
people classified as non-farm thus do not live in an incorporated place of at least 2,500
people and they sell less than $1,000 worth of agricultural products, if any. More likely,
they live outside a town but hold a factory or urban job. They truly represent the dispersed
population that is such a hallmark of North Carolina. Between 1960 and 1990 the state's
rural population increased 19.6 percent as part of the overall increase of 45.5 percent.
However, the rural non-farm component grew by a robust 63.2 percent whereas the rural
farm total plummeted by nearly 86 percent during the same 30 year period. The number of
people living on farms fell by over 690,000 and their share of the state total declined from
17.7 to just 1.8 percent. North Carolina had the largest farm population of any state in the
nation in 1960 but by 1990 it had fallen to fifth place. Conversely, the rural non-farm
Figure 4. N.C. Urban/Rural Population, 1960 - 1990
8
Po
pu
la
ti
on
in
Mi
ll
io
ns
1960 1970 1980 1990
Source: U.S. Census
12/16/97
segment increased its share of the North Carolina population from 42.7 to 47.9 percent
between 1960 and 1990.
In many cases, of course, the shift from farm to non-farm represented a
shift in employment rather than residence. Many farmers gave up tilling the soil for a
factory or other wage job but still lived on the original farm. Some kept a garden while
many leased out or sold their fields to other farmers. This switch in employment was made
possible by a spread of manufacturing facilities to rural areas and led to extensive inter-
county commuting by these displaced farmers. Other rural non-farm residents, probably
the great majority, were never farmers but simply chose to live in a rural setting and, like
the ex-farmers, commute to jobs at rural factories or in town. They are found in the outer
fringes of the metropolitan areas as well as in the more truly rural parts of the state.
Gender
In the last thirty years, females have continued to increase both in number
and in their proportion of the total population. From 1960 to 1990, females increased
from about 2.3 million to over 3.4 million. During that time the male population increased
by about 45 percent while the female total rose by about 48 percent. As a result, the male
per 100 females ratio declined steadily, from 97.3 in 1960 to 95.9 in 1970, 94.3 in 1980,
and 94.1 in 1990. This tendency is not surprising because of two factors that influence
sex ratios generally. The first is that women generally live longer than men and that women
have higher survival rates than do men at most ages. The second factor is that net
migration into North Carolina has not been particularly sex-specific for either males or
females, as it has been in the past in true " boom areas," such as Alaska during the
construction of the Alaskan pipeline by a predominantly male labor force, or in " bust
areas," such as parts of Appalachia when mostly males left the region to find work
elsewhere.
12/16/97
II. INTERNAL GROWTH PATTERNS
Major Regions
The division of North Carolina into four traditional land regions, Tidewater,
Inner Coastal Plain, Piedmont and Mountains, is a conventional practice that derives not
only from vanations in the nature of the land but also from different patterns of occupance
and use of the land (Figure 5). These regions are as much historical as they are
physiographic. European settlement on the Tidewater and Inner Coastal Plain was
predominantly from English stocks from Virginia or in from the coast. Originally these
areas had an "Old South" culture based primarily on slave-based plantation systems of
production. More recently, the Inner Coastal Plain became the state's agricultural heartland
and 1ts most rural area. Most of the region’s recent growth has been in and around its
larger cities, especially Greenville, Fayetteville, Goldsboro, Jacksonville and Rocky
Mount. A good part of this growth has been associated with nearby military facilities. The
Tidewater area has grown vigorously in recent decades due to the attraction of the beaches
especially along the Outer Banks and the southeastern coast. Historic cities such as New
Bern and Wilmington are booming as service centers for nearby beach areas.
The Piedmont was settled mainly by Europeans of Scots-Irish and German
stock who migrated southward from Pennsylvania in the 18th century. Most of their farms
have been replaced by all of North Carolina's largest cities and a highly industrialized
countryside. Settlementin the coves and valleys of the mountains took place mostly a little
later and these communities remained isolated until recent investments in transportation
facilities were made. Today the scenic beauty of the region draws in thousands of tourists
and retirees.
In the colomal period and during the early decades of the Republic the
Coastal Plain held the majonty of the state's population. This began to change in favor of
the Piedmont in the early 19th century and for some time the eastern part of the state, which
holds 41 of its 100 counties, contained about one-third of the population. Since about
1960 both the absolute and the relative population size of the Piedmont has increased,
Figure 5. Physiographic Regions of North Carolina
— 7)
~"_Northampton } { o\ }
/
3 { Hertford
Halifax A
Nash / ;
grater iy a :
:
Wi { ER eh \ A AEN
Ed be
A! gecombed Tytrel { yr 3,
Ne pt \ rt { Dare) 3
Wilson % 4 AA oT A Fin ¥ Lr
X Ny i er had LR
Johnston / ay be ‘Hyde =;
By { Greene
1% / Wayne y he /
Harnett : WE
inner Coastal ht
Sire Lenoir &
— Plain sr
/ Pi
\ Cumbarand |
; \ Sampson
) ~
7
Tidewater
0 50 100 miles
L 1 i
9 T 1
0 50 100 kilometers
» 12/16/97
going from 51 percent of the state total in that year to 56 percent in 1997 (Figure 6).
Perhaps more telling, the region accounted for nearly 64 percent of North Carolina's net
growth between 1960 and 1997. The Coastal Plain counties collectively declined to 30.5
percent of the statewide total by 1997 but there was a significant shift within the region.
While the Tidewater portion increased its share from 9.4 to 10 percent, the counties of the
Inner Coastal Plain saw their share fall from 24.6 to 20.5 percent between 1960 and 1997.
Meanwhile, the 24 Mountain counties experienced a fall from 14.8 to 13.5 percent of the
statewide total.
Despite these relative shifts, the Inner Coastal Plain's actual population rose
from 1.309 million in 1960 to 1.523 millionin 1997. The Tidewater section had a sharper
growth rate, going from 552 thousand to 745 thousand during the same time. The
Mountain counties increased their total from just over 673 thousand to one million in 1997.
The Piedmont total, 2.309 million in 1960, reached 4.167 million in 1997. In other words,
growth occurred throughout the state but it was strongest in the most urban and industrial
parts.
The Piedmont also contained 52 percent of North Carolina's non-white
population but the region remained 79 percent white in 1990. A rapidly growing share of
the non-white population in the Piedmont’s cities is made up of Asians and some of the
white portion 1s Hispanic. In the Inner Coastal Plain is found 35 percent of the state's non-
white population and this ethnic group makes up almost 40 percent of the region's total
population. Most of these non-whites are African Americans but the group also includes
the large Native American population in Robeson and near-by counties. The Tidewater
section 1s 24 percent non-white, contributing 10 percent to the statewide total. The
mountain region is the state's "whitest," containing just over two percent of the total
number of non-whites.
10
Figure 6. Regional Growth Trends, 1940 - 1997
4,500
4,000
3,500
3,000
2,500
2,000
1,500
500 a
emip———"""
0
1940 1950 1960 1970 1980 1990 1997
Year
Po
pu
la
ti
on
(in
th
ou
sa
nd
s)
Age Groups
esses \oOuntian
ee Piedmont
esmme [nner Coastal Plain
ammse | (dewater
Source: U.S. Census
12/16/97
Growth Factors
There are three pnmary sets of factors that have accounted for most of the
growth within the state. The first is the influence of the several urban centers in the state
that have acted and continue to act as magnets to economic activities and subsequent
population expansions. Charlotte, Raleigh-Durham, Greensboro/ Winston-Salem, and
smaller metropolitan areas such as Asheville, Fayetteville, Greenville, Hickory,
Jacksonville, Rocky Mount and Wilmington have successfully attracted economic growth
in today's highly competitive global economy. These urban centers influence population
dynamics in two different ways. One is that their employment opportunities tend to attract
numbers of people both to their core counties and to adjacent counties that are under their
influence. The other influence is on the type of people urban centers tend to attract. Net
migration to these areas is often age-selective, in that larger numbers of young adults in
their child-rearing ages settle in and near urban centers. This type of selectivity tends to set
the stage for future growth through natural increase.
The second factor influencing the patterns of change across the regions of
North Carolina is the presence of certain amenities which also serve as magnets to in-
migrants. In the case of the mountains, the net-migration flows may also be age-selective,
in that they tend to attract proportionally higher rates of older people who seek retirement
homes in particular areas of the mountains that are likely to have the types of services they
need in smaller communities. Another amenity area is the coast, which also tends to be
more age-selective in its year-round population. Particularly important are the coastal
beaches, the Intracoastal Waterway, or areas in the immediate vicinity. The golf courses
that have been developed in the Southern Pines/Pinehurst area have attracted a large
retirement community as well.
The third factor that may influence population change at the county level is
the presence of large institutions, such as colleges and universities, and military
installations, that grow or decline by administrative action. There are fifteen counties
whose age structure is significantly affected by the presence of these institutions. These
include the university/college-impacted counties : Alamance, Durham, Guilford, Harnett,
11
12/16/97
Jackson, Mecklenburg, New Hanover, Orange, Pitt, Wake and Watauga and also the
military-impacted counties: Craven, Cumberland, Onslow, and Wayne. These types of
institutions differentially attract younger adults who typically do not age in place, but
instead, are regularly replaced by other adults. Hence, they are places where population
turnover is common. The military bases also tend to attract large civilian workforces to
support their missions. The university/college areas also offer some special amenities
associated with the schools that are attractive for large numbers of new residents, especially
retirees. Examples include collegiate sports and a host of cultural activities.
County Growth Patterns
Figure 7(a) shows that the decade of 1970 to 1980 was a boom time for
many counties in North Carolina, especially those in the Piedmont. Three counties in the
mountains grew by 30 percent or more during that decade, as did four in the Piedmont and
four along the coast. The mountain counties of Swain ( Fontana Lake) , Henderson
(Hendersonville ) and Watauga (Appalachian State University ) had started to become
attractive to retirees during the late 1970's, as did Brunswick, Carteret, Dare and Currituck
counties along the coast. In addition, Currituck and Brunswick counties benefited from
spill-over development from the Norfolk-Virginia Beach-Newport News area and Myrtle
Beach, South Carolina, respectively. During this time period, Orange, Durham and Wake
counties were beginning to benefit from the attraction of high-tech research facilities to the
Research Triangle Park . The interplay of the influence of urban centers, amenity areas and
institutions were also evident in those counties that grew 20-29 percent during that decade.
Lincoln and Union Counties benefited from their proximity to Charlotte, growth In
Wilmington impacted the rest of New Hanover and adjacent Pender counties, and
Randolph benefited from its proximity to Winston-Salem and Ashboro. Amenity factors
influenced high rates of change for Clay and Macon counties (mountains), Burke and
Alexander (lakes), and Moore (golf retirement communities). Nearby military institutions
played a major role in the growth of Hoke and Pitt counties. Only three counties recorded
population declines, Hertford and Northampton on the northeastern Inner Coastal Plain,
and Jones County, in the central Tidewater region.
Figure 7.a. Population Change, 1970 - 1980
10-19
0-9
Population Loss
NC = 15.7%
Source: U.S. Census.
% » 12/16/97
From 1980 to 1990 the pattern of growth rates changed significantly (Figure 7b).
The greatest variations appeared in the Tidewater region of the state where overall growth
was 21 percent, well above the statewide rate of 12.6 percent. However, there was
considerable variation among its counties. Four of the Tidewater counties (Hyde, Jones,
Tyrrell and Washington) lost population and six (Beaufort, Camden, Chowan, Craven,
Pamlico, Pasquotank and Perquimans) grew at rates slower than the overall state average.
The others, in contrast, experienced strong growth. Dare County was the fastest growing
in the state, growing by two-thirds. Brunswick increased by over 42 percent and Currituck
and Pender had growth rates of 23 and 29 percent, respectively. While it expanded by
“only” 16 percent, New Hanover County had the region’s largest absolute gain of over
16,000 people. The 23 counties on the Inner Coastal Plain, away from the beaches, are
rural and most do not have the advantage of large institutions. Collectively, they grew at a
slow 6.1 percent rate and ten of them actually lost population.
In the Piedmont region, there was less variability in rates, but there were clearly
"winners " and " losers" in population numbers. Anson, Caswell and Richmond Counties
lost population. At the other extreme, Wake County, even with its large population base in
1980, grew over 40 percent and generated growth that spilled over into nearby Durham,
Franklin, and Orange Counties. Other counties in the Piedmont that were tied to the several
urban centers in this region grew at rates of at least 20 percent. Mecklenburg grew faster
than any other county in its region, adding over 105,000 people at a robust 26 percent clip.
Only Wake and Mecklenburg grew by more than 100,000 people during the decade. The
other large Piedmont Counties, Forsyth and Guilford, expanded more modestly, 9.1 and
9.5 percent, respectively, slower than the statewide rate. Collectively, these two counties
added just over 52,000 people to their totals.
In the mountains, the flurry of growth that characterized the 1970's slowed
or disappeared. Three counties (Ashe, Graham and Swain) lost population and overall the
region grew by only 6.3 percent between 1980 and 1990. Henderson, Macon and
Watauga Counties were the only ones to grow by more than 16 percent. Buncombe, site of
Asheville, the regional capital, added nearly 14,000 people to its population, on a growth
rate of 8.6 percent.
Figure 7.b. Population Change, 1980 - 1990
7 oy 7
7 7 Z a
7
GLI gh
~_ | Population Loss
NC = 12.8%
Source: U.S. Census.
4 » 12/16/97
Figure 7(c) shows that between 1990 and 1997 growth was again the
general rule. The seven-year, statewide growth rate of 12.1 percent almost matched that of
the previous decade. Only five counties lost population. Four (Hertford, Hyde, Tyrrell
and Washington) are in the northeastern part of the state and the fifth (Alleghany) is in the
mountains. Wake County accelerated its phenomenal growth, adding over 130,000 people
in the seven-year period, at a state highest rate of almost 31 percent. Clearly, it is gaining
on Mecklenburg County, which grew by 15.7 percent and added almost 95,000 people.
Six other counties had growth rates of 20 percent or more and all six are suburban to one of
the metropolitan area core counties. Two, Brunswick and Pender, are adjacent to
Wilmington. Currituck is part of the Norfolk, Virginia area; Hoke borders Fayetteville,
Johnston is immediately east of Raleigh and Union is suburban to Charlotte. Growth was
above average in a number of other suburban metropolitan counties, especially Cabarrus,
Chatham, Franklin, Harnett, Stokes and Yadkin Counties. Dare County lost its pride of
place but still grew by almost 20 percent. Actually, the high growth rates experienced in
the Tidewater region seemed to have peaked, with the region growing by only 11.5
percent, less than the statewide average.
Internal Migration Trends
The most dynamic cause of population change is through migration, either
net in-migration or out-migration. By definition, migration involves a change of residence.
It can also be regarded as "people voting with their feet." It is a much more volatile factor
than natural increase since it can change suddenly and is driven by individual decision
making rather than by generally more predictable demographic factors. Figure 8, a map of
net migration between 1980 and 1990, shows that the aforementioned statewide trend
toward increasing in-migration is not evenly distributed throughout North Carolina. In
some cases counties had net out-migration but they still managed to show a little growth
because the loss due to migration was offset by a positive natural increase. Edgecombe
and Lenoir, predominantly rural counties on the Coastal Plain, lost over 3,000 people due
to migration, but produced enough babies to little more than break even in population
growth for that decade, for example. Many other counties in the Coastal area with
significant concentrations of blacks and Native-Americans, who tend to have higher fertility
14
Figure 7.c. Population Change, 1990 - 1997
Percent Change
Bl 18.00 and above
12.00 - 17.99
6.00 - 11.99
0.00 - 5.99
’_ | Population Loss
NC = 12.3%
Source: U.S. Census and N.C. Office of State Planning.
12/16/97
rates than the general population, had net gains through natural increase that also were large
enough to offset losses due to migration. Cumberland County, with its ties to the military,
stands out in that it was a huge loser ( -12,377 ) in migration, but a big gainer from
natural increase ( 39,783 ).
In the Mountains and the Piedmont, counties that did not benefit from the
presence of urban centers lost people in greater numbers than were attracted to those areas.
Henderson County, a major destination for retirees, had a net growth of 10,705 people
between 1980 and 1990, all but 643 of which was due to in-migration. The influence of
urban centers as magnets for growth is also apparent on the map. Gains of over 10,000
people were found in Mecklenburg (Charlotte), Durham (Durham), Guilford
(Greensboro/High Point), Wake (Raleigh), and New Hanover (Wilmington) Counties.
Wake (91,969) and Mecklenburg (68,835) were the only counties to record a net in-
migration of 20,000 or more. Other counties that attracted net in-migrations of 10,000 or
more were the coastal amenity areas adjacent to Wilmington, Brunswick County, the
military-driven economy of Onslow County (Jacksonville) and two university counties,
Orange (Chapel Hill) and Pitt (Greenville). Forsyth (Winston-Salem) and Buncombe
(Asheville) Counties barely missed experiencing a net in-migration of 10,000 people.
No fewer than 35 of North Carolina's 100 counties experienced net out-
migration between 1980 and 1990. While a number managed to grow slightly despite this
out-migration, the effects can still be harmful. Typically out-migration is "negatively
selective." Thatis, itis usually the younger adults, who are more energetic, better skilled
and ambitious, who leave. Those who remain are more likely to be older, the very young
and the least capable. The loss becomes a downward spiral as the funds needed to correct
the problem through investments in education, health and infrastructure, must be extracted
from a smaller population and a declining economy.
Of the 35 counties that had net out-migration, 12 lost 2,000 or more and
only one, Cleveland, is not in the eastern part of the state. Similarly, most of the smaller
net losers were in the eastern part of the state while some were in the mountains. A few of
the more rural counties on the Piedmont had small net out-migrations also. Another way of
15
T
E
I
STE
A
, 1980 - 1990
—-
c
S
$
i
$
©
oO
n
e
|
—-—
-
—
p=
f=
EF
20
Q
D
)
oO
3
S
Zz
£
2
0
—-
j=
|
|
Z
L
R
a
Lin
—
7p)
(o)
O
o
4
p
)
L
-
=
pment
(@))
®)
ND
Ss
@
E
2
E
c
oO
0
.
0
Cr
Oo
OD
Ww
2
-
I
oO
i
(@))
Qe
OO
oO
ee
L
C
i:
2
-
0p
ob
D
I
O
N
OD
:
—
o
o
o
C
I
I
o
=
fo
&
-
C
l
0
O
i
OG
an
wo
©
yuan
-
i
Q
O
fast
<
2
12/16/97
looking at the pattern of migration is to note that Wake and Mecklenburg Counties alone
accounted for 43 percent of the state's total net in-migration.
Figure 9 displays an estimate of migration that occurred between 1990 and
1995. These estimates affirm the tendency for in-migration to be strong in and around
major metropolitan areas and in recreational-retirement areas, along the coast and in the
mountains. A possibly significant change from the previous decade is that far fewer
counties recorded net out-migration. During the previous decade, some 35 counties,
mostly on the Coastal Plain or in the mountains, had net out-migration but that number
dropped to only 11 during the 1990-95 period. Significantly, three of the losers,
Cumberland, Onslow and Wayne are eastern metropolitan counties that contain large
military facilities. Of the remaining losers, all but one are along the coast or the Inner
Coastal Plain. Montgomery County, on the Piedmont, was the lone exception to this
eastern trend. All other Piedmont and mountain counties had net in-migrations. This
apparent reversal of rural migration patterns may indicate an increased movement of retirees
and other persons who are attracted to the environmental amenities that many rural areas
provide. This trend also may be in line with a US Census report that in 1995-96 more
people moved out of US metropolitan areas than moved in. This apparently indicates a
growing preference for living in a lower density, quasi-rural setting but not too far away
from urban services and amenities. So far there is no indication that North Carolina’s
metropolitan areas are losing population- quite the contrary. This is due at least in part to
the fact that the state’s metro areas still include large sparsely developed fringe areas that
provide an ostensibly, if temporary, rural setting. It remains to be seen if this trend toward
more rural living will increase because of a rise in telecommuting, improved highways,
higher urban crime rates and other factors that drive people out of urban areas and permit
them to leave.
Key Racial and Ethnic Groups
Another important demographic pattern is that of key racial or ethnic groups
across the counties of North Carolina. North Carolina is 75.5 percent white, a proportion
that has remained rather stable in recent decades. This is true also in metropolitan areas as
16
Figure 9a. Total Net Migration 1990 - 1995
Number of Persons
en 10,000 and above
Bl 5.000 - 9,999
1,000 - 4,999
| ]0-999
i) Loss
N.C. Total Migration = 305,816.
Figure 9b. Migration Rate 1990 - 1995
Rate of Migration
(percent)
Bl 0.2 and above
Bl 66-91
0-25
Bl Loss
N.C. Average = 4.6 percent.
Source: N.C. Office of State Planning.
12/16/97
well. In the 13 largest counties that are central to metropolitan areas, the white proportion
declined very slightly between 1980 and 1990, from 75.2 to 74.2 percent. In the other 87
counties the white proportion increased during the same time from 76.2 to 76.7 percent. In
61 one of these 87 counties the non-white population recorded net out-migration.
As noted earlier, the single largest minority group in North Carolina is composed
of African Americans. The relative strength of their presence across the counties of
Coastal Plain North Carolina is evident in Figure 10. Except in the beach amenity areas
along the coast, they made up a third or more of these counties’ population in 1990. Many
of those counties are poor and have limited economic opportunities. The Piedmont is very
mixed in terms of the proportion of blacks. In the counties with larger urban centers, the
number of blacks may be significant, but their proportions are diluted by the larger
numbers of non-blacks there. Several parts of the Piedmont and virtually all of the
mountain counties have less than 10 percent of their populations that are black. Within the
municipalities that are the state's 10 largest cities the black population increased marginally
between 1980 and 1990, from 32.4 to 32.7 percent of the population.
The rapid increase in the number of Asians that was mentioned earlier was
concentrated principally in the state's urban areas. About 77 percent in 1990 resided in the
13 largest metropolitan counties, where they increased by over 157 percent between 1980
and 1990. The rate of increase in the other 87 counties was also high (117 percent) but the
total changed involved only 6,491 persons of Asian descent whereas the 13 metropolitan
counties gained 24,597 persons. A similar pattern was followed by Hispanics. Their
numbers increased by 55.5 percent in the 13 metropolitan counties and only 13 percent in
the rest of the state. By 1990 the 13 largest metropolitan counties contained 60.7 percent of
North Carolina's Hispanic citizens.
17
Figure 10. Afro-American Population, 1990
Percent of Total Population
40 or more
30 - 39
20 - 29 L 100 miles
0 50 100 kilometers
10 - 19
0-9
Source: U.S. Census
12/16/97
III. FUTURE GROWTH TRENDS
Projected Growth
In the past, North Carolina's population grew slowly, especially during its
"Rip van Winkle" stage. In recent years growth has exceeded national averages and people
are moving in rather than leaving. The North Carolina Office of State Planning projects
that the state will have 7,713,383 residents in the year 2000, a total to be achieved through
a record-shattering net in-migration of 698,038 people between 1990 and 2000. The state
planners foresee a population of over 9.3 million by 2020. The projected growth between
1990 and 2020 includes nearly 1.8 million net in-migrants, a level that is expected to be
exceeded only by California, Florida, Texas and Washington. These in-migrants will
account for no less than two-thirds of North Carolina’s net growth between 1990 and
2020.
As shown earlier, in the past North Carolina grew only because of high birth rates
and large families that offset out-migration. More recently, families have gotten much
smaller as the state has become more urban and prosperous. Now the state much depend
for its growth on attracting large numbers of new residents. Attracting such large numbers
is generally a function of a strong economy and maintaining an attractive quality of life. If
the economy falters or the environment deteriorates seriously it is likely that growth will
drop sharply, perhaps abruptly. Furthermore, having to depend on in-migrants for growth
will favor the larger metropolitan areas and selected rural, high amenity areas. For many
other small towns and rural areas, with limited economic bases or amenity attractions, it
will be difficult to attract new residents.
In addition to the danger posed by depending on newcomers for growth, the recent
floodtide of new residents is bringing major cultural change with it. There is more ethnic
diversity, of course, but there also are more subtle changes as people from all over the
country and indeed the world move into the state in increasing numbers. Daily newspapers
witness this in a steady stream of letters complaining about rude “Yankees” or crude
“Rednecks.” People from the northeast bring a love for ice hockey, an unknown sport for
18
12/16/97
most natives, while NASCAR races are new to the recent armivees. Catholic churches grow
faster than the Presbyterian churches that were founded by Scots-Irish settlers. Mexican
and Thai restaurants stand next to Bubba’s barbecue pit. Migrants from Texas think
barbecue should be made from beef and they totally miss the distinction between “Down
East” and “Lexington” styles of barbecuing pork. The list goes on but the point is that both
native North Carolinians and their new neighbors are going through a period of social and
cultural change that is unprecedented in the state’s history. While most of the examples of
this may seem trite, the adjustments are real and promise to simultaneously threaten and
improve the quality of life in the state.
Internal Variations in Growth
Equally as significant as 1s the projected statewide growth is the question of
how it will be distnbuted within the state between 1990 and 2020. The North Carolina
Office of State Planning breaks its projections down to the county level and they reveal
some very significant trends (Figure 11). The state's largest metropolitan areas, those
centering on Charlotte, Raleigh-Durham and Greensboro/Winston-Salem are increasingly
dominating the North Carolina economy. This is true especially for Charlotte and Raleigh-
Durham and within the counties that are proximate to them. The core of the Charlotte
region is made up of Mecklenburg, Cabarrus, Gaston and Union Counties. Mecklenburg
will add 367,514 residents on a 72 percent growth rate. Raleigh-Durham is focused on
Durham, Franklin, Johnston, Orange and Wake Counties. Wake County alone is expected
to add 492, 635 people to its population. Its 116 percent growth rate will be the highest in
the state, propelling it past Mecklenburg to be the state's most populous county by 2020.
Central to the Trad area are Davidson, Forsyth, Guilford and Randolph Counties.
Collectively, the 13 counties in the Charlotte, Raleigh-Durham and Greensboro/Winston-
Salem areas contained 38.2 percent of the state population in 1990 but between 1990 and
2020 they are projected to capture the majority (54.6 percent) of the net statewide growth of
2,713,519 people, raising their collective share of the state total to 43 percent.
Eight more counties (Buncombe, Catawba, Cumberland, Nash, New
Hanover, Onslow, Pitt and Wayne) that are central to the state's other metropolitan areas
19
Figure 11. County Population Projections, 1990 - 2020
Percent Change
61.0 and above |
40.9 - 60.9
20.0 - 40.8
00.0-19.9
Loss
— Increase
Projected Growth Rate for the Total State is 40.9%.
Source: North Carolina Office of State Planning, 1996.
® a 12/16/97
are projected to account for another 17.2 percent of the 1990-2020 increase, leaving just
28.2 percent (763,173) to be divided among the remaining 79 counties. Clearly, then,
unless some major, unexpected shifts occur, growth in this state will be dominated to an
unprecedented extent by its metropolitan areas, especially its larger ones. The Raleigh-
Durham cluster of counties is projected to grow by 86.9 percent between 1990 and 2020
and the Charlotte cluster will increase by 58.3 percent. However, the seven smaller
metropolitan counties, at 41.5 percent, are expected to grow faster than the
Greensboro/Winston-Salem area, which is projected to gain by just 31.1 percent, less than
the statewide increase rate of 40.9 percent. However, all four groups of metropolitan
counties are expected to out-perform the remaining 79 counties, those that are not central to
one of the state’s metropolitan areas, as they will add only 28.1 percent to their 1990 totals
in the 30-year projection period.
Within this group of 79 counties, 10 are projected to experience absolute
population losses between 1990 and 2020 and as many as 26 will have net out-migrations.
These losing counties are primarily non-metropolitan and in the east, with most of the rest
in the mountains and a few on the Piedmont. These estimates of both growth and losses
are not law, of course, but they represent the best judgments of professional
demographers. In essence, the projections portray a future that is substantially different
from the past. Until recently, North Carolina was a state that, despite being the 11th most
populous and eighth largest in manufacturing, was characterized by a relatively dispersed,
rural/small town population and a lack of large cities. By contrast, the Raleigh-Durham and
Charlotte areas are emerging as million-plus core urban areas and their full metropolitan
areas will be even larger. The Triad area and the other metropolitan areas will claim yet
more shares of the growth. The remaining 79 counties will grow less vigorously except
for a few along the coast, in mountain recreation areas or in proximity to metropolitan
areas. Many of the smaller ones, especially on the Inner Coastal Plain, are returning to
classic Southern rural patterns of past decades, marked by net out-migration and the
downward cycle that comes with it. Only those counties that are within commuting reach
of the metropolitan jobs centers or that have significant recreational resources can hope to
escape this negative trend.
4 » 12/16/97
Thus, it appears that the historic basis for the perception of North Carolina
as a rural/small town state is rapidly disappearing. In its place is a new reality in which the
state's population and economy are dominated by its metropolitan areas, especially by
Raleigh-Durham and Charlotte. In many respects this means that the state 1s moving
toward a pattern that is more typical of other states. Many may understandably mourn the
loss of North Carolina's predominantly rural/small town character but this new reality
provides a more accurate basis for managing the future of the state. Ironically, the best
chance for helping the left behind rural areas is to ensure that the burgeoning metropolitan
areas are able to function properly and compete successfully in the high tech, information
processing, global economy of the future. If this happens because of wise business
leadership and supportive public policies then the state may have the resources to look after
those areas that are not getting their share of the growth.
21
Figure 12. Congressional Districts (1997 House & Senate Plan A)
50 100 miles
1
T 1
50 100 kilometers
Source: NC General Assembly Legislative Services Office.
% » 12/16/97
IV. IMPLICATIONS FOR CONGRESSIONAL DISTRICTS
The many and rapid changes that are occurring in North Carolina’s
population, especially the internal distribution within the state, create a problem for those
attempting to delineate electoral districts that meet the “one man, one vote” test. The state’s
12 US House of Representative districts were designed to meet this test by drawing them in
such a way as to put almost exactly one-twelfth of the North Carolina population in each
district. The latest set of districts were approved by the 1997 General Assembly in
response to a US Supreme Court decision that struck down an earlier version that included
two “Majonty minority” districts. The new plan, “97 House/Senate Plan A,” divided the
state’s 6,628,637 residents among the 12 districts, ranging from a low of 551,842 in the
Fourth District to a high of 553,333 in the Tenth (Figure 12). An alternative plan that
narrowed this extremely small spread even further was prepared in case the US Justice
Department or the courts found fault with 97 Plan A. Several legal challenges to these new
districts appear to be forthcoming and the potential exists for the courts to order a revision
of the 97 Plan A districts during the latter part of the 1990’s.
A major problem is that all of the recent districts were drawn by using data
from the 1990 Census, including the 1997 boundary revisions. Not only was this required
by law but the decennial census is the only data source that gives detailed information on
population totals and characteristics for small, sub-county areas that is based on actual
counts. Other population sources are estimates based on surrogate data, such as building
permit records, new telephone connections and the like or on data such as birth and death
counts. Similar information is used as well to prepare projections of future growth trends
which, by their nature, are more speculative in nature. When carefully done, these
estimates and projections can be reasonably accurate but the fact remains that they are
estimates rather than an actual census. Furthermore, they are rarely prepared at levels
below that of the entire county. This is the kind of post-1990 data that was displayed
earlier for North Carolina and its counties.
Estimates and projections that were prepared by the NC Office of State
Planning use the most widely accepted methodologies. Further, the professional staff has a
Figure 13. Population in NC Congressional Districts (Plan 1997 A)
800
mee LHGACE
Average
700
S
600
Di
st
ri
ct
Po
pu
la
ti
on
(i
n
th
ou
sa
nd
s)
500
1990 1997 2000 2005
Source: U.S. Census Population and Housing 1990; NC Office of
State Planning, September, 1997
Nb 12/16/97
close working knowledge of the state that enables them to base their projections on
reasonable assumptions about the future of North Carolina. These estimates and
projections were used to show the distribution of population that has developed or is
expected to develop in the 97 Plan A districts. These estimates and projections were
prepared for 1997, 2000 and 2005 and compared with the 1990 totals. Because the post-
1990 data exist.only for whole counties it was necessary to estimate the growth in portions
of districts that are parts of counties. The 97 Plan A districts split 22 of the state’s 100
counties. That proportion of the county total that was attributed to a district based on 1990
data was calculated as a percentage of the county population. That percentage was then
applied to the 1997 and subsequent data. Thus, if 20 percent of, say, Wayne County’s
1990 population was assigned to a particular district under the 97 Plan A then that same
proportion was assigned to the 1997 or later data in order to determine the new population
for that district. The possibly exists, of course, that the effected portion of the county may
have grown either faster or slower than the county as a whole but there is no basis for
knowing that. This possible error is offset by the fact that 78 of the counties were not split
in the 97 Plan A districts.
The results of the estimates for 1997, 2000 and 2005, as expected, show a
wide divergence among most of the districts (Figure 13). The average district should have
619,724 residents in 1997, 642,782 in 2000 and 678,230 in the year 2005. In 1997
Districts 6, 8 and 9 diverge from the statewide average by 0.4 percent or less but five
districts have departures of over four percent. District 2 is more than eight percent above
the average while district 1 is more than six percent below. The maximum spread between
the largest and smaller districts is thus more than 14.5 percentage points, only seven years
after the 1990 Census. The projected growth out to 2005 sees this divergence increase to
26 percentage points and half of all the districts will be at least four percent above or below
the statewide average.
In absolute terms, the maximum population spread among the districts in
1990 was 1,491 persons (Table 1). This is estimated to reach 90,960 in 1997, 123,661 in
2000 and by 2005 it is projected to rise to 178,723. The slowest growth is anticipated in
districts that are predominantly on the Coastal Plain (Districts 1 and 3) or in rural parts of
12/16/97
the northern Piedmont and in the mountains (Districts 5, 10 and 11). The most rapid
growth is expected around Raleigh-Durham (Districts 2 and 4), Charlotte/Greensboro/
Winston-Salem (District 12) and Wilmington (District 7). The remaining three districts are
anticipated to stay fairly close to the state average.
By the year 2005 both Mecklenburg (699,269) and Wake (680,630)
Counties are projected to have populations that will be well above the statewide district
average of 678,230 people. This would qualify those two largest metropolitan counties to
have their own Congressional districts. The three other largest counties, Cumberland,
Forsyth and Guilford, will not qualify for single county districts although Forsyth and
Guilford together will have enough people to qualify for a two county district. The more
rural districts are expected to fall well below the statewide average and will need to have
their areas enlarged, substantially in most cases.
By law and because of the margin of error that is inherent in any estimates
and projections of population, these statistics cannot and should not be used as a basis for
revising the existing districts. However, they do make it clear that the 1990 Census data
are substantially out of date and, therefore, to revise the current districts based on 1990 data
is highly likely to create rather great inequities in the distribution of population among the
districts. Results of the 2000 Federal Census will be available in a few years and that data
will provide more accurate data that would allow the delineation of districts that will be
much more in line with how the state changed during the 1990’s.
; » 12/16/97
TABLE 1
POPULATION IN NORTH CAROLINA
CONGRESSIONAL DISTRICTS
(97 Plan A)
District 1990 1997 2000 2005
1 552,161 580,214 589,612 599,649
2 552,152 670,174 713,273 778,372
3 552,622 592,000 610,653 646,785
4 551,842 662,991 702,284 769,560
5 552,084 595,762 609,772 626,670
6 552,171 617,217 638,807 669,343
7 552,382 631,269 657,122 695,091
8 553,143 619,983 643,797 679,402
9 552,615 617,531 640,712 678,181
10 553,333 610,530 628,834 652,541
11 552,089 607,573 625,205 646,898
12 552,043 628.505 654,794 696,606
NC Average 552,386 619,724 642,782 678,230
NCTotal 6,628,637 7,436,690 7,713,383 8,138,759
Sources: Calculated from data in the US Census (1990) and from the NC Office of State
Planning. Numbers for 1990 are actual, others are projections.
25
CURRICULUM VITAE
ALFRED WRIGHT STUART
PERSONAL:
Professor of Geography, Department of Geography & Earth Sciences
University of North Carolina at Charlotte, Charlotte, NC 28223
Home: 1037 Greentree Drive, Charlotte, NC 28211
Telephone: Work (704) 547-4257;FAX 704-547-3182;
Email: awstuart@email.uncc.edu; Home (704) 364-4562
Bom: 11/16/32 in Pulaski, Virginia; grew up in Roanoke, Virginia.
Married: Mary Louise Moyers; four children, five grandchildren
Served in U.S. Army, Corps of Engineers, 1956-1958;
Active Reserves, 1953-1956.
HIGHER EDUCATION:
Virginia Military Institute, 1951-1953
University of South Carolina, B.S. (Geology), 1955
Emory University, M.S. (Geology), 1956
Ohio State University, Ph.D. (Geography), 1966
PROFESSIONAL EXPERIENCE:
e Research Assistant, Snow Ice Permafrost Research Establishment,
U.S. Army Corps of Engineers, Greenland, Summer, 1957.
» Glaciologist, U.S. Antarctic Research Program. Chief glaciologist at
Scott Base, Antarctica and on the 1959-60 Victoria Land Geophysical
Traverse, August 1958-April, 1960.
e Research Associate, Institute of Polar Studies, The Ohio State
University, April, 1960-June, 1961.
Assistant Instructor of Geography, The Ohio State University,
January, 1962-March, 1963.
e Community Planner, Planning Department, City of Roanoke,
Virginia, March, 1963-September, 1964.
e Urban Planner (faculty member), U.S. Bureau of Mines, 1968-69.
» Consultant, Urban Decentralization Study, Oak Ridge National
Laboratory, Oak Ridge, Tennessee, Summer, 1969.
Assistant Professor of Geography , The University of Tennessee-
Knoxville, 1964-69.
e Graduate Advisor, Department of Geography, University of
Tennessee, 1966-69
Associate Professor of Geography, University of North Carolina at
Charlotte, 1969-73.
Professor of Geography , University of North Carolina at Charlotte,
1973-present.
e Chairman, Department of Geography and Earth Sciences, UNC
Charlotte, 1969-77; 1979-1988.
Director, Center for Applied Community Research, American
Chamber of Commerce Researchers Association (ACCRA), 1988-1997.
* Interim Chairman, Department of Criminal Justice, UNC Charlotte,
1991-92.
e Director, ACCRA Community Profiles Project, 1991-1997.
PROFESSIONAL ORGANIZATIONS:
Southeastern Division, Association of American Geographers
American Chambers of Commerce Researchers Association
Lambda Alpha Land Economics Society- Organizing Committee,
Piedmont Chapter, Vice President for education
HONORS AND AWARDS:
Mount Stuart (6,549 feet), Victoria Land, Antarctica
U.S. Polar Medal
American Men and Women of Science
Who's Who in the South and Southwest
Lambda Alpha International Land Economics Honorary Society
Phi Kappa Phi, national honor society
Faculty Service Award, UNCC Alumni Association, 1996
TEACHING AND RESEARCH INTERESTS:
Arctic and Antarctic Geography
Manufacturing Geography
Demographic and Economic Patterns & Trends in North Carolina and
the South
Locational Analysis for Commercial and Industrial Facilities
Trends Analysis for Strategic Planning and Economic Development
MAJOR FOREIGN TRAVEL:
Greenland, Summer, 1957
Antarctica, 1958-60
New Zealand, 1958 and 1960
Northwest Territories of Canada (MacKenzie River area), Spring, 1976
Great Britain and Europe, Spring, 1985.
Scotland and England, Summer, 1990.
GRANTS AND CONTRACTS: (total from external sources = $1,371,653.20 (11-97)
e UNC Charlotte Research Grant - 1972.
» National Science Foundation SST Program - Urban-Environmental
Studies Program for Gifted Eleventh Grade Students, 1974-1975,
$12,500 per year.
* N.C. Atlas Project - 1973-75, Funding from Z. Smith Reynolds, Smith-
Richardson, Burlington Industries and UNC Charlotte Foundations (with J. Clay
and D. Orr), $74,000.
Southern Research Project - First Union National Bank and the
Surtman Foundation (with J. Clay and D. Orr), 1977, $20,000.
» Church Location Study - Mecklenburg Presbytery, 1982, $3,500.
e Industry Targeting Study - Greater Charlotte Economic
Development Council, Inc., 1982, $10,000.
» Oxmoor Press - graphics production in the Land of the South, 1983-
86, $65,000.
» Hazardous Waste Study, N.C. Board of Science and Technology,
1984-85, $10,000.
» Martin-Marietta Workshop for Earth Science Teachers - 1984, $8,600;
1985, $10,000; 1986, $10,500.
» Charlotte Chamber - Charlotte-Mecklenburg Atlas, 1986-87, $28,050.
» Concord-Cabarrus Foundation - Feasibility of Civic Center, 1987,
$5,000.
» UNC Institute for Transportation Research and Education,
Classification of NC Counties, 1988, $22,814.
» NC Rural Economic Development Center, Locational Satisfaction of
North Carolina Manufacturers, $31,700.
» Southeastern Educational Improvement Laboratory, 1988, $2,500.
* Institute for Transportation Research and Education and the N.C. Rural Economic
Development Center. Industrial Survey and Functional Classification of Counties,
$53,800, 1989.
» Metrolina Economic Development Association, preparation of
Charlotte Metro Region Economic Atlas, $30,000, 1989.
* Charlotte Chamber of Commerce, preparation of Charlotte-
Mecklenburg Atlas, 1991-92, $35,675.
David Taylor and Westinghouse Corporation, Ronald Taylor
Awards Program, $2,000 annually 1989-93; $2,500, 1994 ; $3,000, 1995
» Knight Foundation, preparation of North Carolina Atlas, 1991-94, $52,000.
* American Chamber of Commerce Researchers Association,
Community Profiles Project, 1992-93, $25,455; 1993-94, $29,288; 1994-
95, $40,235 ; 1995-96, $39,472; Oct.-Dec. 1996, $9,859: 1997, $41,081.
» American Chamber of Commerce Researchers Association. Applied
Community Research Program, 1988, $15,656.25; 1989, $26,750; 1990,
$23,200; 1991, $6,875; 1992, $8,500; 1993, $11,330; 1994, $14,950; 1995,
$14,030; 1996, $14,030; 1997, $7,763.
e NC Department of Transportation, Aviation Division, Economic Impact of
Publicly-Owned Airports in North Carolina, 1995-96, $ 217,287.
e Charlotte Uptown Development Corporation, Update of Uptown
Charlotte Map, 1995, $5,747.
» Lambda Alpha Honorary society, Carolinas Chapter, Graduate
scholarships in geography, 1995, $2,400; 1996, $2,700; 1997, $2,300
e NC Department of Transportation, Aviation Division, General
Aviation Study, 1996-97, $ 129,106.
e UNC Charlotte Urban Institute, Economic Impact of Charlotte-Douglas
International Airport, 1997, $5,000.
e NC Department of Transportation, Aviation Division, Commercial Air Passenger
Survey, 1997-98, $165,000.
PUBLICATIONS:
A. Articles in Refereed Publications
1. “Dolomitic Limestone and Shale in the Fairmont Area,”
Georgia MineralNewsletter, Autumn, 1956.
2. "Glaciological Work of the 1959-60 Victoria Land Traverse,"
Journal of Glaciology, 111, 30 (1961), pp. 997-1002 (with A. J.
Heine).
3. "Glaciological Observations on the Ross Ice Shelf Near Scott
Base, Antarctica," Journal of Glaciology, 1V, 34 (1963), pp. 399-
414 (with C. Bull).
4. "The Suburbanization of Manufacturing in Small Metropolitan
Areas: A Case Study of Roanoke, Virginia," The Southeastern
Geographer, VII (1966), pp. 23-38.
5. "Jones and Laughlin Steel Corporation: An Analysis of Plant
Locations," The Pennsylvania Geographer, VII, No. 2 (May
1969), pp. 1-8 (with John E. Benhart).
6. "Metrolina: A Southern Dispersed Urban Region," The
Southeastern Geographer, XII, No. 2 (November 1972), pp. 101-
111. Reprinted in Smith, Vernon M.; Steila, Donald;
Stephenson, Richard A.; editors, North Carolina: A Reader.
Geneva, Ill.: Paladin House Publishers, 1975, pp.17-27.
7. "Uneven Growth: Southern Population Changes at the County
Level," Economic Review, Federal Reserve Bank of Atlanta,
LXVIII, No. 6 (June, 1982), pp. 43-49 (with J.Clay).
8. "Role of Transportation in Manufactures' Satisfaction With
Locations," Transportation Research Record, No. 1274, pp. 12-23.
Transportation Research Board, National Research Council, 1990
(with D. Hartgen, W. Walcott and J. Clay).
S. "Manufacturers' Views of Transportation's Role in Site
Satisfaction," Transportation Research Record, No. 1305, pp.313-
325. Transportation Research Board, National Research Council,
1991 ( with D. Hartgen and K. Sickles).
10. "I-40 Economic Development Study: Growth Points Analysis,"
Transportation Research Record. No. 1359, pp. 91-98
Transportation Research Board, National Research Council,
1992, (with D. Hartgen, J.Clay, W. Walcott, T. Newsome).
11. “Keeping Time: A Unique Study of Suburban Labor Sheds
Assists In Charlotte’s Economic Development,” Charlotte: The
Real Estate Report, vol. II, pp. 25-31. Charlotte Chamber of
Commerce, 1994.
12. “Contemporary Migration in North Carolina,” Tar Heel Junior
Historian, vol. 34, No. 2, Spring, 1995, pp. 33-36, (with Laura
Baum).
13. “The Charlotte Urban Region,” Snapshots of the Carolinas:
Landscapes and Cultures, pp. 109-114. Association of American
Geographers, April, 1996.
14. “Charlotte Area Labor Shed Study,” Charlotte : The Real Estate
Report. Charlotte: Chamber of Commerce, pp. 25-31, vol. II,
1996-97.
15. “Manufacturing in Charlotte-Mecklenburg,” Charlotte: The Real Estate
Report, in press.
. Technical Reports
1. Glaciology, Victoria Land Traverse, 1959-60, The Ohio State
U. Research Found., Report 968, Part I, 1961.*
2. Parks, Playgrounds, Open Space, Roanoke Dept. of City
Planning, 1963.
3. School Plan, Roanoke Department of City Planning, 1964.
4. Community Facilities and Services, Roanoke Dept. of City
Planning, 1964.
5. Roanoke's Economic Resources, Roanoke Dept.of City
Planning, 1965.
6. Housing Needs for Senior Citizens, Roanoke Dept. of City
Planning, 1965.
7. The Materials Handling Industry, (Charlotte: Economic
Development, First Union Nat. Bank), 1977 .*
8. Balanced Growth Policy: A Response (Charlotte: Piedmont
Urban Policy Conference), 1978 .*
9. "Dilworth Business Area," Ch. 2 in the Dilworth Design Plan,
by Lane, Frenchman and Associates, prepared for the Dilworth
Community Development Association, January 1984.*
10. Employment and Household Projections-Mecklenburg County,
December, 1984 and a Synoptic Report, February 1985, Charlotte-
Mecklenburg Planning Commission. *
11.Pockets of Opportunity: Economic Development Research for
Lower Income Neighborhoods. Charlotte Chamber of
Commerce and the City of Charlotte, 1987.*
12.Jobs, Highways and Regional Development in North Carolina,
UNC Institute for Transportation Research and Education, 1988.*
13. Economic Assessment and Projections for Uptown Charlotte.
Charlotte Uptown Development Corporation, January 1989.*
14. Labor Shed Around A Site Near Carmel and Johnston Roads In
Southern Mecklenburg County, North Carolina, Charlotte
Chamber of Commerce, May, 1989.*
15. The Role of Transportation In Economic Growth and
Development, UNCC Transportation Academy Transportation
Publication Series, No. 15, October, 1989. *
16. Classification of North Carolina Counties, UNC Institute for
Transportation Research and Education. UNCC Transportation
Academy Transportation Series, No. 16, October, 1989.*
17. Locational Satisfaction of Manufacturers in North Carolina,
SE Universities Transportation Research Center and
the North Carolina Rural Economic Development Center,
June, 1990. UNCC Transportation Academy Transportation
Series, No. 27, October, 1990.*
18. Economic Notebook, Division of Business and Industry
Development, N.C. Department of Commerce, 1990.*
19. I-40 Economic Impact Study: Business Survey, UNCC
Transportation Academy Transportation Series, No. 35, October,
1990.%
20. I-40 Growth Points Analysis, N.C. Division of Community
Assistance, March, 1991 .*
21. Cleveland County and the Charlotte Metro Region, Cleveland
County/ Cleveland Co. Chamber of Commerce, July, 1991
22. Population and Economic Change in the Providence Presbytery,
Providence Presbytery, Rock Hill, SC, August, 1991.
23. Labor Shed Analysis in the I-40 Corridor, N.C. Division of
Community Assistance, September, 1991.%
24. Population and Church Membership Trends in Portions of
Mecklenburg and Union Counties, North Carolina, Charlotte
Presbytery, December, 1991.
25. Population and Membership Trends and Survey of
Parishioners, The Episcopal Diocese of North Carolina, Long
Range Planning Committee, January, 1992.*
26. Economic Development Analysis and Strategy for Stanly
County, UNC Charlotte Urban Institute, 1992.
27. Economic Overview of the Catawba River Valley, Centralina
Council of Governments, 1993.
28. Cabarrus County: An Overview , Share the Vision, Strategic
Planning Program, Cabarrus County, 1993.
29. Regionalism in the Asheville Area, Asheville Regional Alliance, 1993*
30. The Demographic and Economic Context of the First and
Twelfth Congressional Districts of North Carolina, N. C.
Department of Justice, 1994.
31. The Upstate Region of South Carolina: Assessment and
Industry Targeting Study, Greenville Chamber of Commerce,
1995.%
32. The Role of the Textile Industry in Shaping the Charlotte
Region, Background paper for a field trip for the 92nd annual
meeting of the Association of American Geographers. April,
1996.
33. Economic Impact of Publicly-Owned Airports in North
Carolina, North Carolina Department of Transportation,
Division of Aviation and University of North Carolina at
Charlotte, Department of Geography & Earth Science, June, 1996.*
Released also as Publication Number 169 of the UNC Charlotte Center for
Interdisciplinary Transportation Studies.
34. Fifty Years of Economic and Demographic Change in North
Carolina: From Mill Village to Metropolis, Department of
Geography & Earth Sciences, UNC Charlotte, September, 1996.
35. Survey of the Motorsports Industry in Cabarrus, Iredell and
Mecklenburg Counties. UNC Charlotte Center for Interdisciplinary
Transportation Studies, December, 1996.*
36. Suburban Sprawl in the Charlotte Region. City of Charlotte and the
Charlotte-Mecklenburg Planning Commission, February, 1997. Also released
as Publication Number 155 of the UNC Charlotte Center for Interdisciplinary
Transportation Studies.
37. Charlotte Five-Year Transportation Plan Review, Publication Number 168,
UNC Charlotte Center for Interdisciplinary Transportation Studies, April,
1997.%
38. Factors Affecting Commercial and General Aviation Airport Activity in
North Carolina, UNC Charlotte Center for Interdisciplinary Transportation
Studies Publication Number 160, May, 1997.*
39. Airport Supply Versus Demand: A Cluster Analysis of General Aviation
Airports in North Carolina, UNC Charlotte Center for Interdisciplinary
Transportation Studies Publication Number 159, May, 1997.*
* Joint project with others.
. Books and Monographs
1. Urbanization and Open Pit Mining: Atlanta, GA, U.S.
Department of Interior Bureau of Mines, Information Circular
8477, 1970 (with R. R. French and D. H. White).
2. Rural Industrialization and Population Growth: The Case of
Arkansas, Oak Ridge National Laboratory, Urban
Decentralization Study, ORNL-HUD-4, June, 1971.
3. "Manufacturing," Metrolina Atlas, Ch. 5, pp. 87-105, ed. James
Clay and Douglas Orr, The University of North Carolina Press,
1972.
4. Co-editor, Population and Housing Characteristics of
Mecklenburg County, N.C., Department of Geography and
Earth Sciences, UNC Charlotte Monograph Series in Geography
No. 1, Spring, 1973.
5. Community Internships for Undergraduate Geography
Students, Commission on College Geography, Association of
American Geographers, 1973 (with Kenneth Corey).
6. North Carolina Atlas: Portrait of a Changing Southern State,
Chapel Hill: UNC Press), 1975. Co-editor of the book and co-
author of Parts I and VI and Chapter 11.
7. Atlas of Charlotte-Mecklenburg, ed. J. Clay (Charlotte: UNC
Charlotte Department of Geography), 1978. Monograph Series in
Geography, No. 2, Co-author pp. 1-6. Second Edition, 198.
8. N.C. Urban Atlas Series, co-edited and authored with J. Clay and
D. Orr. A series of nine 36-page atlases on North Carolina's
Urban Regions. (Charlotte: UNC Charlotte Department of
Geography and Earth Sciences and the Urban Institute), 1982-83.
O. Charlotte: Patterns and Trends of a Dynamic City, with J. Clay,
(Charlotte: UNCC Dept. Geog. and Earth Sci.), 1987, 64 pages.
10. Land of the South, with J. Clay, D. Escott, D. Orr, Oxmoor
House, 1989.
11. Charlotte: Patterns and Trends , with J. Clay, (Charlotte:
UNC Charlotte Department of Geography and Earth Sciences),
2nd Edition, 1992.
12. North Carolina Atlas, (Chapel Hill: UNC Press), in preparation.
Co-edited with J. Clay and D. Orr.
13. Our Region Tomorrow, Charlotte Regional Atlas, editor and
author, Centralina Council of Governments, September, 1994.
14. Growth and Development Trends in the Greater Charlotte
Region Since 1990, Centralina Council of Governments,
November, 1995.
REVIEWS:
« Review of "Atlas of Antebellum Southern Agriculture" for N.C.
Historical Society Journal, 1985.
« Review of "High Hopes for High Tech: Microelectronics Policy in
N.C." Journal of Regional Science, Vol. 26, No. 4, 1986.
« Research Proposal reviewer for the National Science Foundation
» Manuscripts for Professional Geographer and Policy
and Change.
CONSULTING:
» Feasibility Studies for Residential, Shopping Center and Office Developments.
Clients include First Federal Savings and Loan, Carmel Land Company,
John Crosland and Carley Capital.
» Commercial Revitalization of Dilworth Community: Lane, Frenchman and
Associates, 1984. .*
» Economic Development Plan for Bristol, Va.-Tenn.: Greater Bristol Area
Chamber of Commerce, 1984. *
» Households, Housing and Employment Projections for Mecklenburg County:
Charlotte-Mecklenburg Planning Commission, 84-85.*
Analysis of Residential Growth Patterns in Mecklenburg County: Presbyterian
Hospital, 1987.
Analysis of Alternative Use Options for the Crockett Park Site in the Dilworth
Area of Charlotte: MECA Properties, 1987.*
» Growth Trends in the South: Strategic Planning Group, Lowes Stores, Inc.,
1986.
» An Analysis of Two Potential Mecklenburg County Sites for a Home Savings of
America Office: Home Savings of America, Inc., 1987.%
General Feasibility of a Multi-Purpose Civic Center in Cabarrus County, Cabarrus
County Civic Foundation, 1987.*
* Business Development Opportunities in the Charlotte Pocket of Poverty:
Charlotte Chamber of Commerce and the City of Charlotte, 1987.*
» Feasibility of a Mixed-Use Development in Cabarrus Co. on I-85 Near the
Charlotte Motor Speedway, ADM Properties, Inc., 1987.*
» Population Basis for a Proposed YMCA in the University Research Park Area,
University Research Park, 1988.
» The Need for New Church Development in NE Mecklenburg and Southeastern
Cabarrus Counties, Mecklenburg Presbytery, 1988.
» Economic Development and Highways in North Carolina, UNC Institute for
Transportation Research and Education, 1988.*
* Employment, Commuting, Population and Traffic Change in the Metrolina Urban
Region. NC Board of Transportation, a UNCC Carolinas Issues Academy
Forum on Regional Change, the Metrolina Economic Development
Association and to a meeting of officials from NC and SC, Spring, 1988.
* Analysis of Major Metropolitan Growth Centers in Seven Southeastern States,
First Land Mark Corporation, 1989.*
* Population Growth Trends in the Seven Counties of the Presbytery of Charlotte,
Presbytery of Charlotte, 1990.
* Analysis of High Growth Areas and New Church Development Needs in
Northern and Southeastern Mecklenburg, Cabarrus and Western Union
Counties, Presbytery of Charlotte, 1990.
* Population Growth Trends and New Church Development Needs in the
Providence Presbytery, South Carolina, 1991.
* Population Growth Trends and New Church Development in Southwestern
Mecklenburg and Union Counties, Presbytery of Charlotte, 1991.
» Demographic and Economic Overview and Issues Survey, Episcopal Diocese of
North Carolina, 1991*
» Economic and Population Overview of Cleveland County, Cleveland County and
Cleveland Chamber of Commerce, 1991.
» Labor Shed Analysis for Three Sites in Mecklenburg County, Charlotte Chamber
of Commerce, 1992.
e Economic Overview of the Catawba River Basin, Centralina Council of
Governments, 1993.
» Environmental Scan for Cabarrus County, Share the Vision, Strategic Planning
Program, 1993.
» Consultative Editor and Author, Centralina Council of Governments, 1993-94.
Regional Building Permits Report, Centralina COG, 1993-present.
» Regional analysis of the Asheville Region, Regional Alliance, 1993.*
» Expert witness, NC Department of Justice, Shaw vs Hunt (NC Congressional
Redistricting Case), 1993-94.
* Industry Targeting Study, Greenville-Spartanburg area, SC. Greenville Chamber
of Commerce, 1995%*
* Analysis of 1990-1994 Regional Building Permit Patterns, Centralina Council of
Governments, 1995.
» Labor Shed Analysis for Nine Sites in Mecklenburg County, Charlotte Chamber
of Commerce, 1996.
» Suburban Sprawl in the Charlotte Region, City of Charlotte, 1997
» Transit Review Panel, Charlotte Department of Transportation, 1997
*Joint project with others. 11-97
UNITED STATES DISTRICT COURT
EASTERN DISTRICT OF NORTH CAROLINA
| EASTERN DIVISION
Civil Action No. 4-96-CV-104-BO(3)
MARTIN CROMARTIE. THOMAS )
CHANDLER MUSE. and GLENNES )
DODGE WEEKS.
Plaintiffs.
AFFIDAVIT OF
V. DR. GERALD R. WEBSTER
JAMES B. HUNT. JR.. in his official
capacity as Governor of the State of North
Carolina, et al..
Defendants.
Gerald R. Webster, being duly sworn, deposes and says:
1, I am a Professor of Geography at the University of Alabama with a PhD in
geography. My primary research and teaching emphases are in political and electoral geography,
including the issue of redistricting.
2. I was asked by representatives of the North Carolina Attorney General’s Office to
evaluate the State’s congressional districting plan based on traditional districting criteria.
3. A true copy of my report in response to that request, An Evaluation of North
Carolina’s 1998 Congressional Districts, is attached hereto and incorporated by reference.
This the J ¢ day of February. 1998.
AN mE
Gerald R. Webster, PhD
Sworn to and subscribed before me this
0 +h day of February. 1998.
Bots O Uancock
Mptary Public
My commission expires: & - 4 -2000
CURRICULUM VITA
GERALD (JERRY) R. WEBSTER
Present Address: 5209 Northwood Lake Drive East
Northport, Alabama 35473
Home Phone: (205) 333-2612
Business Address: Department of Geography
Box 870322
University of Alabama
Tuscaloosa, Alabama 35487
Department Phone: (205) 348-5047
Office Phone: (205) 348-1532
Fax: (205) 348-2278
Email: GWebster@ualvm.ua.edu
Personal Data: Born June 2, 1953 in Bremerton, Washington;
Graduated High School from Mannheim American
High School, Mannheim, West Germany, 1971;
Married 1982 to Roberta Haven Webster (Ph.D.,
1994, Geography, University of Kentucky); One
child, Miranda Kathleen, born 1988.
EDUCATION
B.A. University of Colorado, Denver, Colorado. Political
Science, 1976.
M.S. Western Washington University, Bellingham, Washington.
Geography, 1980. Thesis Title: "The Economic Impact of
Canadian Tourism in Whatcom County, Washington: An
Examination of Selected Factors Influencing Canadian
Cross-Border Activity."
Ph.D. University of Kentucky, Lexington, Kentucky. Geography,
1984. Dissertation Title: "The Spatial Reorganization
of the Local State: The Case of County Boundaries in
Kentucky."
POSITIONS HELD
Professor, Department of Geography, University of Alabama. 8/97
-- present.
Associate Professor, Department of Geography, University of
Alabama, 8/92 -- 8/97.
Assistant Professor, Department of Geography, University of
Alabama, 8/89 -- 8/92.
Assistant Professor, Department of Geography and Recreation,
University of Wyoming, 8/85 -- 7/89.
Visiting Assistant Professor (leave of absence replacement),
Department of Geography, University of Miami, Coral Gables,
Florida. . 8/84 ~— 5/85.
Visiting Instructor (sabbatical replacement), Department of
Geography, University of Illinois, Urbana, Illinois. 1/84 --
5/84.
Instructor, Department of Geography, University of Kentucky,
Lexington, Kentucky. 6/82 -- 8/82; 6/83 --8/83; and 6/84 ~--
8/84.
Teaching Assistant (full teaching responsibilities), Department
of Geography, University of Kentucky, Lexington, Kentucky. 1/81
-- 5/81; 8/82 -- 5/83; and 8/83 -- 12/83.
Instructor, European Division, University of Maryland,
Bremerhaven, West Germany. 6/81 -- 9/81.
Research Assistant, Department of Geography and Regional
Planning, Western Washington University, Bellingham, Washington.
9/79 -- 6/80.
Teaching Assistant, Department of Geography and Regional
Planning, Western Washington University, Bellingham, Washington.
8/78 -- 6/79.
COURSES TAUGHT (no. of times as of Fall 1997)
Introduction to Geography (3)
Introduction to Physical Geography (4)
Introduction to Climatology (2)
Introduction to Human Geography (12)
Introduction to World Regional Geography (27)
Social and Cultural Geography (1)
Urban Geography (7)
Political Geography (8)
Geography of Middle America (1)
Geography of Latin America (2)
Introduction to Land Use Planning (3)
Research Methods/Traditions (4)
Seminar on the Political Geography of the United States (2)
Participation in Computer Based Honors Program, University of
Alabama (4) :
Miscellaneous Conference and Readings Courses including the
Geography of Europe, the Geography of Latin America, the
Geography of the Soviet Union, The Geography of Religion in the
U.S., Social and Cultural Geography, The Geography of the Rocky
Mountain Region, The Geography of UN Voting, Mexico in the
International System, Section and Party in India, Nation and
State in Africa, NGOs and the International System, Precolumbian
Settlement Planning and Design in Mexico.
3
PRIMARY TEACHING INTERESTS
Lower Division Upper Division
Human Geography Political Geography
World Regional Geography Planning
Planning Urban Geography
Middle America
Research Methods/Traditions
THESES AND SELECTED NON-THESIS PAPERS DIRECTED
In progress: Chris Evilla (thesis).
Pat Vaum (non-thesis).
Kenneth Kassem (1997), "The Geographic Distribution of Marine
Protected Areas in the Americas," Non-thesis paper.
Victoria Tinnen (1997), "Women Scientists: Down the Path Less
Traveled," Non-thesis research paper.
David Norris (1996), "The Effectiveness of Affirmative
Gerrymandering at the Local Level in Alabama," Non-thesis
research paper.
Kathleen O'Reilly (1996), "The Electoral Geography of Anti-Gay-
Rights Referenda in Oregon, 1988-1994," Thesis. Presentation
from Ms. O'Reilly's thesis won the outstanding research paper by
a Masters student at the 1995 SEDAAG meeting, and an Honorable
Mention in the Political Geography Specialty Group's Student
Paper Competition in 1996. An article from her thesis is
forthcoming in the Professional Geographer.
Nel Ruffin, (1996), "Sinkholes in the Marble and Dolostone Karst
of Sylacauga, Alabama," Thesis. Presentation from Ms. Ruffin's
thesis won the outstanding research paper by a Masters student at
the 1996 SEDAAG meeting.
Valerie Stout (1996), "Electoral Geography of Legislative Support
for the 'Takings Law'," Non-thesis research paper.
Robert George (1996), "Alabama's License Plate: A Symbol of the
Massive Resistance?," (subsequently published in International
Social Science Review), and "A Vernacular West," Non-thesis
papers.
Suzanna Hartely (1994), "Modeling Foreign Direct Manufacturing
Decisions in the Southern United States," Thesis.
Sutherland, Cynthia (1994), "Compactness of Congressional
Districts in the Southeast," Non-thesis research paper.
4
John Puckett (1992), "The Conversion of Agricultural Land in
Madison, Alabama, 1950-1987," Non-thesis research paper.
Mark Greer (1992), "Regional Alignment in United Nations' Cold
War Voting, 1946-1985," Thesis, University of Wyoming.
Majorie L. Varuska (1989), "Changing of the Guard: The Successor
Generation and NATO," Non-thesis research paper, University of
Wyoming.
Jacqueline V. Nolan (1986), "Ministate Voting in the United
Nations," Non-thesis research paper, University of Wyoming.
PRIMARY RESEARCH INTERESTS
Redistricting
Geography of United Nations Voting
Geography of Fiscal Federalism
Spatial Organization/Reorganization of Local Government /Local
Government Service Provision
Southern Politics
Electoral Geography/Regionalism and Change in the United States
Geography of the Caribbean
RESEARCH PRESENTATIONS
"Hispanic Population and Congressional Support for NAFTA," with
Chris Merrett, Southwest Council of Latin American Studies,
Havana, Cuba, March 1998, intended.
"Debating the Confederate Battle Flag in the South Carolina
Legislature," Association of American Geographers, Boston,
Massachusetts, March 1998, scheduled.
"Congressional Support for Free Trade: The Geopolitical Economy
of Voting Behavior," with Chris Merrett, Southeastern Division of
the Association of American Geographers, Birmingham, Alabama,
November 1997.
"Religion and Politics in the American South," Southeastern
Division of the Association of American Geographers, Birmingham,
Alabama, November 1997.
"playing a Game with Changing Rules: Geography, Politics and
Redistricting in the 1990s," Invited presentation at National
Center for Geographic Information and Analysis sponsored
conference on "Geographic Information Systems and Political
Districting: Social Groups, Representational Values and Electoral
Boundaries," Buffalo, New York, October 1997.
5
"Ideological Change in Congress: Race, Region and Redistricting,
1988-1996" National Council for Geographic Education, Orlando,
Florida, October 1997.
"A New Tariff Map of the United States: Congress and the United
States in a Global Economy," with Chris Merrett, Mid-Continent
Regional Science Meeting, Indianapolis, Indiana, June 1997.
"Section versus Sector: Regional and Economic Influences on
Congressional Support for Free Trade," with Chris Merrett,
Conference on Frontiers of Research in Political Geography, San
Marcos, Texas, April 1997.
"Whose South is it Anyway? The Politics of Representation on the
Southern United States Landscape," with Jonathan I. Leib and
Roberta H. Webster, Association of American Geographers, Ft.
Worth, Texas, April, 1997.
"The Election of Women to Congress and State Legislatures in the
South, 1920-1996," Southeastern Division of the Association of
American Geographers, Athens, Georgia, November 1996.
"on Enlarging the Size of the House," prepared comments for
Symposium on Redistricting in Theory and Practice After Shaw
Versus Reno, Association of American Geographers, Charlotte,
North Carolina, April, 1996.
"Five Determinants of the 1996 Presidential Election," prepared
comments for Panel Discussion on the 1996 Presidential Election,
Association of American Geographers, Charlotte, North Carolina,
April, 1996.
"Jdeological Polarization in Congress in the 1990s: Race, Region
and Redistricting," Association of American Geographers,
Charlotte, North Carolina, April, 1996.
"partisan Shifts in Presidential and Gubernatorial Elections in
Alabama, 1932-1994" Southeastern Division of the Association of
American Geographers, Knoxville, Tennessee, November, 1995.
"Geography and American Governmental Structure," National Council
for Geographic Education, San Antonio, Texas, October, 1995.
"process and Results of Legislative Redistricting in Alabama in
the 1990s," Association of American Geographers, Chicago,
Illinois, March, 1995.
"Redistricting and Ideological Shifts in the U.S. House of
Representatives, 1992-1993," Southeastern Division of the
Association of American Geographers, Virginia Beach, Virginia,
November, 1994.
6
"The Power of an Icon," with Roberta H. Webster, National Council
for Geographic Education, Lexington, Kentucky, November, 1994.
"The Process and Results of Districting in Alabama in the 1990s,"
Invited presentation at Conference on Districts and Voting
Equality," University of North Carolina at Wilmington, September,
1994.
"The United States Senate, the United Daughters of the
Confederacy and the Confederate Flag," with Roberta H. Webster,
Alabama Academy of Science, Troy, Alabama, March 1994,.
"Congressional Redistricting in the Southeast in the 1990s,"
Southeastern Division of the Association of American Geographers,
Greensboro, North Carolina, November 1993.
"The Alabama Black Belt: Decline of a Core Area," with Scott
Samson, National Council for Geographic Eduction, Halifax, Nova
Scotia, August 1993.
"Gubernatorial Republicanism in Alabama: A Transition?,”
Association of American Geographers, Atlanta, Georgia, April,
1993.
"Geography of the Presidential Debates," with Cynthia Sutherland,
Alabama Academy of Science, Huntsville, Alabama, March, 1993.
"cuba in a Post-Cold War World," Department of Geography Speakers
Series, University of Kentucky, Lexington, Kentucky, November
1992.
"Congressional Redistricting and Black Representation in Alabama
in the 1990s," Southeastern Division of the Association of
American Geographers, Louisville, Kentucky, November, 1992.
"Cuba: Moving Back to the Future with Tourism," National Council
for Geographic Education, Santo Domingo, Dominican Republic,
September 1992.
"Alabama's Transition to the Republican Party in Presidential
Elections: Did it Happen in 1948?" Association of American
Geographers, San Diego, California, April 1992.
"The Geography of the Senate Vote in the Confirmation of Clarence
Thomas," Alabama Academy of Science, Tuscaloosa, Alabama, April
1992.
"Conversion of Agricultural Land in Madison County, Alabama,
1950-1987," with John Puckett, Alabama Academy of Science,
Tuscaloosa, Alabama, April, 1992.
7
"cuba Looks for a Way Out," Geography Awareness Week, University
of Alabama, Tuscaloosa, Alabama, December 1991.
"Geographical Distribution and Impact of New Deal AAA Outlays to
Alabama Counties," Southeastern Division of the Association of
American Geographers, Asheville, North Carolina, November 1991.
"The Cold War in the United Nations," with Mr. Mark Greer, Great
Plains/Rocky Mountain Division of the Association of American
Geographers, October, 1991.
"Latin American Support for the U.S. in the UN: A Longitudinal
Test of the Foreign Aid Connection," Association of American
Geographers, Miami, Florida, April, 1991.
"The United States and Latin America: An Analysis of Foreign Aid
and Voting in the UN General Assembly, 1966-1985," With Mr.
Joseph Strength and Mr. Colby Allsbrook, Alabama Academy of
Sciences, Jacksonville, Alabama, March, 1991.
"The United States, Middle America and the United Nations: The
Distribution of American Foreign Aid and Voting Support in the
General Assembly," National Council for Geographic Education,
Williamsburg, Virginia, November, 1990.
"Middle American Support for the U.S. in the UN General Assembly:
A Cross-Sectional Analysis of the Foreign Aid Connection,"
Conference of Latin Americanist Geographers, Auburn, Alabama,
October, 1990.
"The Changing Geography of Federal Grants to State and Local
Governments, FY81-FY88," Association of American Geographers,
Toronto, Ontario, Canada, April, 1990.
"Federal Government's Balance of Payments with the States, FY76-
FY87," Southeastern Division of the Association of American
Geographers, Charleston, West Virginia, 1989.
"Congress and the Changing Distribution of Federal Outlays, FY81-
FY86," Association of American Geographers, Baltimore, Maryland,
1989.
"Federal Taxes and Spending: Regional Fiscal Flows, FY76-F¥87,"
Conference of Geography and Public Administration," International
Geographical Union, Washington, D.C., March, 1989.
"pre-Hurricane Gilbert Jamaican Landscapes," Geography Awareness
Week Presentation, Sponsored by the University of Wyoming
Geography and Recreation Club and GTU Chapter, November 1988.
8
"Electoral Regions and Predictions About the 1988 Presidential
Election," Sponsored by the University of Wyoming Political
Science Club, November 1988.
"The Spatial Redistribution of Federal Outlays to the States,
FY81 -- FY85" Association of American Geographers, Phoenix,
Arizona, 1988.
"politicians, Elections and Changing Federal Spending in the
States in Reagan's First Term: A Macro Level Search for
Associations," Conference on Electoral Geography, IGU, Los
Angeles, California, 1988.
"World Maps - Viewpoints and Propaganda," Geography Awareness
Week Presentation, Sponsored by the University of Wyoming Common
Ministry, November 1987.
"Partisanship in Presidential, Senatorial and Gubernatorial
Elections in Ten Western States," Association of American
Geographers, Portland, Oregon, 1987.
"The Interior West and Electoral Alignment in Presidential
Elections," Association of American Geographers, Minneapolis,
Minnesota, 1986.
"An Intra-Regional Examination of Republican Party Electoral
Strength in the Interior West," Mid-Continent Regional Science
Association, Breckenridge, Colorado, 1986.
"Once Liberal, Now Conservative: Ethnicity and Voting in Miami,
Florida," with Roberta Haven Webster, Association of American
Geographers, Detroit, Michigan, 1985.
"The Spatial Reorganization of the Local State: Reforming Local
Government Service Provision in Kentucky s Counties," Association
of American Geographers, Finalist in Nystrom Competition,
Detroit, Michigan, 1985.
"Winners and Losers in Reaganomics: Who Got What, Where?" with
Stanley D. Brunn and David Lowery, Conference on the Allocative
and Distributive Impacts of Reagan Administration Policies,
Alexandria, Virginia, 1984.
"Socioeconomic Well- -Being and Intergovernmental Revenue Transfers
to Local Governments in Kentucky, 1960-1972," Association of
American Geographers, Washington, D.C., 1984.
"Questions on Questions: A Critique of Textbook Guide
Achievement Testing," with Justin C. Friberg, National Council
for Geographic Education, Toronto, Canada, 1984.
9
"The Geography of 'Wagner's Law' at the Local Government Level in
Kentucky," Association of American Geographers, Denver, Colorado,
1983.
"The Geography of Local Government Debt in Kentucky," Kentucky
Academy of Science, Louisville, Kentucky, 1983.
"Testing the Geography of 'Wagner's Law' at the Local Government
Level: Constant and Current Dollar Comparisons," Southeastern
Division of the Association of American Geographers, Orlando,
Florida, 1983.
"Testing Testing: Improving the Quality of Multiple-Choice
Examinations," East Lakes Division of the Association of American
Geographers, Cincinnati, Ohio, 1983.
"A Computer Derived County Consolidation Plan for the State of
Kentucky," Association of American Geographers, San Antonio,
Texas, 1982.
"Geographic Dimensions of Local Government Finance in Kentucky,
1957-1977," Kentucky Academy of Science, Ashland, Kentucky, 1982.
"The Spatial Reorganization of County Boundaries in Kentucky,"
Southeastern Division of the Association of American Geographers,
Memphis, Tennessee, 1982 (winner of award for best paper and
presentation by a Ph.D. student).
"County Consolidation in Kentucky: An Historical Perspective,"
Kentucky Academy of Science, Murray, Kentucky, 1981.
"Exchange Rates and Canadian Cross-Border Movements to Whatcom
County, Washington," Southeastern Division of the Association of
American Geographers, Atlanta, Georgia, 1981.
RECENT GUEST LECTURES
"Minority Rights, Redistricting, and the Impact of Recent Court
Decisions," Mortar Board Conference on Social Studies Issues for
Alabama Teachers, (3/97).
"The Redevelopment of the Cuban Tourist Industry in the 1990s,"
Economic Geography and Tourism Class, University of Alabama,
(3/97).
"The Geography of the 1996 Elections," Alabama Geographical
Society, (11/96).
10
"Social/Demographic Dimensions of the Alabama Black Belt," Soils
Class, Dept. of Geography, University of Alabama, (5/96), Joint
class on Environmental Racism, (10/97).
"The Five Themes and the Alabama Black Belt," Summer Teachers
Workshop, Dept. of Geography, University of Alabama, (6/95).
"Kuwait and Syria," lectures at Samford University (11/94, 5/95,
11/95, 5/96), Shelton State Community College (11/94).
"Kuwait after the War," lectures for the University of Alabama
International Student Association (12/94), Mortar Board
Conference on Social Studies Issues for Alabama Teachers (2/95).
"Redistricting in the 1990s," Mortar Board Conference on Social
Studies Issues for Alabama Teachers (2/95).
ny.S. - Cuba Relations: Past, Present and Future," University of
Alabama, Latin American Studies Program (4/95).
"Regions and Regionalizations: Examples from Latin America,"
World Geography Today, Televised High School Honors Geography
Class, University of Alabama, (2/93).
"Population Geography: Examples from Latin America," World
Geography Today, Televised High School Honors Geography Class,
University of Alabama, (11/91).
nUrbanization and Mexico City," World Geography Today, Televised
High School Honors Geography Class, University of Alabama,
(3/91).
PAPERS AND PROJECTS CURRENTLY IN PROGRESS
Flint, Colin, and Webster, Gerald R. (1998), "Geography of Hate
Crimes," in data analysis phase, with initial presentations
expected in 1998.
Leib, Jonathan I.; Webster, Gerald R., and Webster, Roberta H.
(1998), "Rebel With a Cause? Iconography and Public Memory in the
Southern United States," under review by Geojournal for special
issue on "Gottman's Iconographies Revisited."
Merrett, Christopher, and Webster, Gerald R. (1998), "Section
versus Sector: Regional and Economic Influences on Congressional
Support for Free Trade," under review by Political Geography.
Shelley, Fred M. and Webster, Gerald R. (1998), "Population,
Settlement, Race and Ethnicity in the South" under review by
Journal of Geography for special issue on the South.
1
Webster, Gerald R. (1998), "Playing a Game With Changing Rules:
Geography, Poltiics and Redistricting in the 1990s," under review
by Political Geography for special issue on GIS and
Redistricting.
Brunn, Stanley D.; Shelley, Fred M.; Archer, J. Clark; Davidson,
Fiona M.; Murphy, Alexander B.; O'Lear, Shannon, and Webster,
Gerald R. (1998), Political Geography of the World, New York, NY:
Guilford Publications, contract signed, writing ongoing.
Webster, Gerald R.; Brunn, Stanley D.; Webster, Roberta H., and
Leib, Jonathan I. (1997/8), "The Political Culture and Geography
of the South," chapter for inclusion in textbook entitled The
Cultural Geography of the South," Michael Roark and Brooks Green,
editors.
MANUSCRIPTS ACCEPTED WITH REVISION
O'Reilly, Kathleen, and Webster, Gerald R. (1998), "The Electoral
Geography of Anti-Gay Rights Referenda in Oregon," Professional
Geographer, accepted with minor revision, revisions now ongoing.
PUBLICATIONS IN REFEREED JOURNALS
Webster, Gerald R. (1998), "A Note on Ideological Change in
Congress: Party, Race, Region and Redistricting," Southeastern
Geographer, forthcoming.
Leib, Jonathan I., and Webster, Gerald R. (1998), "On Enlarging
the U.S. House of Representatives," Political Geography, Vol.
17(3): 319-328.
Webster, Gerald R. (1997), "Religion and Politics in the American
South," Pennsylvania Geographer, special issue on geography and
religion, forthcoming.
Ingalls, Gerald; Webster Gerald R., and Leib, Jonathan I. (1997),
"Fifty Years of Political Change in the South: Electing African
Americans and Women to Public Office," Southeastern Geographer,
Golden Anniversary Issue, Vol. 37(2): 140-161.
George, Robert C. and Webster, Gerald R. (1997), "'Heart of
Dixie' on the Alabama License Tag: Where Did It Come From and
Does It Represent the Past, the Future or Both?," International
Social Science Review, Vol. 72 (1/2): 33-49.
Webster, Gerald R. (1997), "Geography and the Decennial Task of
Redistricting," Journal of Geography, Vol. 96(2): 61-68.
Webster, Gerald R. (1997), "The Potential Impact of Recent
12
Supreme Court Decisions on the Use of Race and Ethnicity in the
Redistricting Process," Cities, Vol. 14(1): 13-19.
Webster, Gerald R. (1996), "Partisan Shifts in Presidential and
Gubernatorial Elections in Alabama, 1932-1994," Professional
Geographer, Vol. 48(4): 379-391.
Webster, Gerald R. (1995), "Congressional Redistricting in the
Southeast in 1990s," Southeastern Geographer, Vol. 35(1): 1-21.
Sutherland, Cynthia L., and Webster, Gerald R. (1994), "The
Geography of the 1992 Presidential Debates," Geographical
Bulletin, Vol. 36(2): 83-93.
Webster, Gerald R., and Webster, Roberta H. (1994), "The Power of
an Icon," Geographical Review, Vol. 84(2): 131-143.
Webster, Gerald R. (1993), "Redistricting and Ideological Shifts
in Congress, 1992-1993," Southern Studies, Vol. 3(l1): 99-112.
Webster, Gerald R. (1993), "Congressional Redistricting and
African-American Representation in the 1990s: An Example from
Alabama," Political Geography, Vol. 12(1): 549-564.
Webster, Gerald R. (1992), "A Time-Series Analysis of Political
Support, Strategic Location and the Geography of U.S. Foreign Aid
to Latin America and the Caribbean, 1966-1987," Geografiska
Annaler, Series B, 74(2): 125-132.
Webster, Gerald R., and Samson, Scott (1992), "On Defining the
Alabama Black Belt: Historical Changes and Variations,"
Southeastern Geographer, 32(2): 179-188.
Webster, Gerald R. (1992), "Geography of a Senate Confirmation
Vote," Geographical Review, 82(2): 154-165.
Webster, Gerald R. (1992), "Cuba: Moving Back to the Future With
Tourism," Journal of Geography, Vol. 9(5): 226-233.
Webster, Gerald R. (1992), "The Demise of the Solid South,"
Geographical Review, 82(1l): 43-55.
Webster, Gerald R. (1991), "Support for the United States in the
U.N. on Cold War Issues and the Distribution of Foreign Aid to
Central American and Caribbean Countries," Geographical Bulletin,
Vol. 33(2): 87-97.
Webster, Gerald R. (1991), "Congress and the Changing
Distribution of Federal Outlays, FY81-FY86," Professional
Geographer, Vol. 43(1): 49-60.
13
Webster, Gerald R. (1989), "partisanship in American
Presidential, Senatorial and Gubernatorial Elections in Ten
Western States." Political Geography Quarterly, Vol. 8{2): l61~
179.
Lowery, David; Brunn, Stanley D. and Webster, Gerald R. (1988),
"The Spatial Impact of Reaganomics: A Test of Six Models,"
Growth and Change, Vol. 19(4): 49-67.
Webster, Gerald R. (1988), "presidential Voting in the West."
Social Science Journal, Vol. 25(2): 211-232.
Webster, Gerald R. (1987), "Size of Place and Voting in
Presidential Elections in the Interior West," Geographical
Perspectives, No. 59 (Spring): 78-92.
Webster, Gerald R., (1987), "Factors in the Growth of Republican
Voting in the Miami SMSA," Southeastern Geographer, Vol. 27(1):
1-17.
Brunn, Stanley D.; Lowery, David and Webster, Gerald R. (1987),
"Regional Winners and Losers in the Reagan Budget Cuts: Who Got
What Where," Environment and Planning C: Government and Policy,
Vol. 5(2): 183-195.
Webster, Gerald R., and Webster, Roberta Haven (1987) "Ethnicity
and Voting in the Miami-Dade County SMSA," Urban Geography, Vol.
8(1): 19-30.
Webster, Gerald R., and Webster, Roberta Haven (1986), "A Note on
Ethnic Bloc Voting in the Miami-Dade County SMSA," Florida
Geographer, Vol. 20: 37-42.
Lowery, David; Brunn, Stanley, D., and Webster, Gerald R.
(1986), "From Stable Disparity to Dynamic Equity: The Spatial
Distribution of Federal Expenditures, 1971-1983," Social Science
Quarterly, Vol 67(1): 98-107.
Webster, Gerald R. (1985), "Socioeconomic Well-Being and
Intergovernmental Revenue Transfers to Local Governments in
Kentucky, 1960-1972," Virginia Geographer, Vol. 16 (Fall-Winter):
19-36.
Webster, Gerald R. (1984), "The Spatial Reorganization of County
Boundaries in Kentucky," Southeastern Geographer, Vol. :24{(1): 14~
29.
Webster, Gerald R. (1982), "Exchange Rates and Movement Across an
International Border: Canadians in Whatcom County, Washington,"
Bulletin of the Association of North Dakota Geographers, Vol. 32:
3-13.
EDITING/BOOK CHAPTERS
Guest Editor, Journal of Geography, special issue on the
Geography of the South, expected summer 1998.
Editor, Newsletter of the Southeastern Division of the
Association of American Geographers, 1997-1998.
Webster, Gerald R. (1998), "political Space and the United
States," in Davidson, Fiona; Leib, Jonathan; Shelley, Fred and
Webster, Gerald, eds. Teaching Political Geography, National
council for Geographic Education, forthcoming in the Pathways
Series.
Davidson, Fiona; Leib, Jonathan; Shelley, Fred and Webster,
Gerald, eds. (1998) Teaching Political Geography, National
Council for Geographic Education, forthcoming in the Pathways
Series.
Webster, Gerald R. (1998), "Process and Results of Legislative
Redistricting in Alabama in the 1990s," in Redistricting,
Community and Representation in the 1990s: A Geographical
Perspective, Fred S. Shelley; Gerald R. Webster, and Jonathan I.
Leib, editors. Syracuse University Press, forthcoming.
Shelley, Fred S.; Webster, Gerald R. and Leib, Jonathan I.,
editors, (1998), Redistricting, Community and Representation in
the 1990s: A Geographical Perspective. (Syracuse: Syracuse
University Press), forthcoming.
Guest Editor, Southeastern Geographer, special issue on the
"political Geography of the South," Vol. 35(1), 1995.
Editor, Political Geography Specialty Group Newsletter, 1994-95.
PUBLICATIONS IN NONREFEREED OUTLETS
EVO A wis A A EE —————
Webster, Gerald R., and Webster, Roberta H. (1996), Instructor's
Manual to accompany Harm J. de Blij and Peter O. Muller, Physical
Geography of the Global Environment (second edition), 346 pp.
Webster, Gerald R. (1994), "Comment on the Status of
Redistricting in Light of Recent Court Decisions," Political
Geography Specialty Group Newsletter, Vol. 14(2): 5-6.
Webster, Gerald R. (1994), "Comment on NAFTA," Political
Geography Specialty Group Newsletter, Vol..14(1): 3-4.
Webster, Gerald R., and Webster, Roberta H. 1993),
15
Correspondence Study Course, GY 103, Introduction to Geography.
College of Continuing Education, University of Alabama, 46 pp.
Webster, Gerald R., and Webster, Roberta Haven (1993),
Instructor's Manual to accompany Harm J. de Blij and Peter O.
Muller, Physical Geography of the Global Environment, 225 pp.
Webster, Gerald R., and Webster, Roberta Haven (1991),
Instructor's Manual to accompany Harm J. de Blij and Peter O.
Muller. Geography: Regions and Concepts, sixth edition, 115 pp.
Webster, Gerald R. (1990), "Wyoming," in Macropaedia Volume (29)
of Encyclopedia Britannica, pp. 428-431.
Webster, Gerald R. (1989), Correspondence Study Course Student
Manual for Geography 303, Introduction to World Regional
Geography, Correspondence Study Department, University of
Wyoming, pp. 125.
Webster, Gerald R., and Webster, Roberta Haven (1988),
Instructor's Manual to accompany Harm J. de Blij, The Earth: A
Physical and Human Geography, third edition, 106 pp.
Webster, Gerald R., and Webster, Roberta Haven (1988),
Instructor's Manual to accompany Harm J. de Blij and Peter O.
Muller, Geography: Regions and Concepts, fifth edition, 129 pp.
Webster, Gerald R. (1983), "The Geography of Local Government
Debt in Kentucky," Proceedings, Kentucky Academy of Science,
Geography Section, Vol. 9: 150-167.
Webster, Gerald R. (1983), "The Geography of 'Wagner's Law' at
the Local Government Level in Kentucky: Constant Versus Current
Dollar Models," Working Papers in Public Administration, No. PA
30-1983, James W. Martin Graduate Center for Public
Administration, The Graduate School, University of Kentucky,
Lexington, Kentucky, 40506-0205.
Webster, Gerald R. (1982), "Geographic Dimensions of Local
Government Finance in Kentucky, 1957-1977," Proceedings, Kentucky
Academy of Science, Geography Section, Vol. 8: 55-72.
Webster, Gerald R. (1981), "County Consolidation in Kentucky:
An Historical Perspective," Proceedings, Kentucky Academy of
Science, Geography Section, Vol. 7: 92-103.
BOOK REVIEWS
Webster, Gerald R. (1998), book review of Political Geography: A
New Introduction, Richard Muir, Journal of Geography,
forthcoming.
16
Webster, Gerald R. (1997), book review of Political Power in
Alabama, Anne Permaloff and Carl Grafton, Social Science
Quarterly, Vol. 78(4): 1031-1033.
Webster, Gerald R. (1996), book review of The Tyranny of the
Majority: Fundamental Fairness in Representative Democracy, Lani
Guinier, Political Geography, Vol. 15(1): 124-126.
Webster, Gerald R. (1996). book review of The American Mosaic:
The Impact of Space, Time, and Culture on American Politics,
Daniel J. Elazar. Geographical Review, Vol. 86(1): 120-121.
Webster, Gerald R. (1995), book review of Quiet Revolution in the
South: The Impact of the Voting Rights Act, 1965-1990, Chandler
Davidson and Bernard Grofman, editors, Social Science Quarterly,
Vol. 76 (2): 474-475.
Webster, Gerald R. (1992), book review of Elections in Chile: The
Road Toward Democratization, 1991, Cesar N. Caviedes,
Professional Geographer, 44(4): 477-478.
Webster, Gerald R. (1991), book review of Geography and Political
Power: The Geography of Nations and States, 1990, Peter M. Slowe,
Geographical Review, Vol. 81(2), pp. 245-247.
Webster, Gerald R. (1988), book review of Electoral Laws and
Their Political Consequences, 1986, Bernard Grofman and Arend
Lijphart, editors, Political Geography Quarterly, Vol. 7(1), pp.
93-94.
Webster, Gerald R. (1987), book review of Cities of the Prairie
Revisited: The Closing of the Metropolitan Frontier, 1986, Daniel
J. Elazar, Urban Geography, Vol. 8(6), pp. 609-610.
Webster, Gerald R. (1987), book review of American Electoral
Mosaics, 1986, J. Clark Archer and Fred M. Shelley, Professional
Geographer, Vol. 39(4), pp. 488-489.
Webster, Gerald R. (1987), book review of Progress in Political
Geography, 1985, Michael Pacione, editor, Professional
Geographer, Vol. 39(1), p. 119.
AWARDS, GRANTS AND CONTRACTS
Consultant /Expert Witness for State of North Carolina on lawsuit
pertaiining to North Carolina congressional districts and state
legislative districts (Cromartie v. Hunt), 1997-present.
Consultant /Expert Witness for Alabama Democratic Conference on
17
lawsuit pertaining to Alabama House and Senate Districts (Rice v.
Bennett) 1997-present.
Consultant/Expert Witness for ACLU/NAACP Legal Defense and
Educational Fund on lawsuit pertaining to City Council Districts
in Cocoa, Florida (Stovall v. City of Cocoa), 1997-present.
Nomination for University of Alabama Arts and Sciences
Distinguished Teaching Fellowship, spring 1997.
Consultant /Expert Witness for the NAACP Legal Defense and
Educational Fund on lawsuit pertaining to County Commission
districting in Baldwin County, Alabama 1997 (Dillard Vv. Baldwin
County Commission), 1997-present.
Consultant /Expert Witness for the NAACP Legal Defense and
Educational Fund on lawsuit pertaining to school board election
districts in Durham, North Carolina, (Cannon v. Durham County
Board of Education) 1996-97.
Consultant /Expert Witness for the NAACP Legal Defense and
Educational Fund on lawsuit pertaining to city council election
districts in Greensboro, Alabama, (Dillard v. City of Greensboro)
1996-97.
Consultant for NAACP Legal Defense and Educational Fund for work
on "Residential Segregation in Tuscaloosa, Alabama" with monies
to support the UA Cartography Lab and an Undergraduate Assistant,
1994-1985.
Received a Joseph J. Malone Fellowship in Arab and Islamic
Studies by the National Council on US-Arab Relations. Supported
a three week study program in Kuwait and Syria, March 15-April 3,
1994.
Nomination for Burnham Outstanding Faculty Member Award,
University of Alabama, November 1993.
Selected as University of Alabama's applicant for White House
Fellowship, Spring 1992.
Recipient of General Research Grant, Research Grants Committee,
University of Alabama. Project on The Spatial Distribution and
Impacts of New Deal Aid. Summer 1991. $6,000.
Recipient of General Research Grant from Association of American
Geographers. Project on "Past Present and Probable Future
Regional Voting Blocs in the General Assembly of the United
Nations." Spring 1991. $394.50.
Nomination for Golden Apple Award for Outstanding Teaching in a
Freshmen-Level Arts and Sciences Course, Geography 303,
18
Introduction to World Regional Geography. College of Arts and
Sciences, University of Wyoming, Spring 1989.
Nomination for International Studies Program Teacher of the Year,
Sigma Iota Rho International Studies Student Honorary Society,
Spring 1989.
Recipient of Basic Research Grant, College of Arts and Sciences,
University of Wyoming. For "Wyoming in Maps Project." 1988-1989.
$2,000.
Recipient of Faculty Growth Award, U.W. Alumni Association,
University of Wyoming. For travel to annual meeting of
Association of American Geographers, Baltimore, Maryland, 1989.
$362.14.
Recipient of Summer Faculty Development Award, College of Arts
and Sciences, University of Wyoming. Research Project on The
Geography of Federal Outlays and Tax Burdens by State, 1969-1986.
Summer 1988. $500.
Nomination for Golden Apple Award for Outstanding Teaching in a
Freshmen-Level Arts and Sciences Course, Geography 303,
Introduction to World Regional Geography. College of Arts and
Sciences, University of Wyoming, Spring 1988.
Recipient of Basic Research Grant, College of Arts and Sciences,
University of Wyoming. Research Project on The Geography of
Federal Outlays and Tax Burdens by State, 1969-1986. 1987-1988.
$2,000.
Awarded Research Semester (no teaching obligations), College of
Arts and Sciences, University of Wyoming, Fall semester, 1987.
Recipient of Basic Research Grant, College of Arts and Sciences,
University of Wyoming. Research Project on Socioeconomic Well-
Being and Intergovernmental Revenue Transfers to Local
Governments in Wyoming and the United States. 1986-1987. $2,000.
Recipient of Faculty Growth Award, U.W. Alumni Association,
University of Wyoming. Research Project on Electoral
Partisanship in Presidential, Senatorial and Gubernatorial
Elections in the Interior West. 1986-1987. $185.
Selected participant in first annual Colloquium on Excellence in
Teaching and Advising, University of Wyoming, April 19-23, 1986,
$900 Stipend.
Grant from Dean, College of Arts and Sciences, University of
Wyoming. Research Project on Republican Party Strength and
Presidential Voting in the Interior West. 1985-1986. $800.
19
Finalist in Warren Nystrom Award Competition, annual meeting of
the Association of American Geographers, Detroit, Michigan,
April, 1985.
New Faculty Starter Grant, Department of Geography, University of
Miami. Research Project on the Growth of Republican Voting in
the Miami SMSA. 1984-1985. $100.
Award for best paper written and presented by a Ph.D. student,
Student Honors Competition, annual meeting of the Southeastern
Division of the Association of American Geographers, Memphis,
Tennessee, 1982.
Exxon Honorarium to attend Guided Design Workshop, annual meeting
of the National Council for Geographic Education, Pittsburgh,
Pennsylvania, 1981.
PROFESSIONAL ORGANIZATIONS
Association of American Geographers
Political Geography Specialty Group, AAG
Latin American Specialty Group, AAG
Southeastern Division, AAG
Institute of British Geographers, Associate
National Council for Geographic Education
Conference of Latin Americanist Geographers
Fellow, American Geographical Society
Southwest Council of Latin American Studies
SERVICE ACTIVITIES (1987 to present)
Appointed to the Editorial Board, Journal of Geography, 1997-
2000.
Member, Local Arrangements Committee for Golden Anniversary
SEDAAG Annual Meeting, Birmingham, Alabama, November 1997.
Elected, Secretary of the Southeastern Division of the
Association of American Geographers (Editor of the SEDAAG
Newsletter), 1996-98.
Appointed to Editorial Board, Southeastern Geographer, 1996-1998.
Elected Chair of the Political Geography Specialty Group,
Association of American Geographers, 1995-97.
Elected Chair of the Nominations Committee, Southeastern Division
of the Association of American Geographers, 1995.
Member of the University of Alabama Latin American Studies
20
Steering Committee, University of Alabama, 1994-95.
Chair, Committee for Rewriting Departmental Tenure and Promotion
Guidelines, Department of Geography, University of Alabama, Fall
1994.
Elected Secretary/Treasurer of the Political Geography Specialty
Group, Association of American Geographers, 1994-95.
Member of the Arts and Sciences Tenure and Promotion Committee,
University of Alabama, 1993-94 - 1994-95.
Member of University Appeals Committee, University of Alabama,
1993-94.
Alternate Member of Faculty Senate, University of Alabama, 1993-
95.
Member of Program Review Committee for Department of Mineral
Engineering, College of Engineering, University of Alabama, 1992-
93.
Member of Interim Program Advisory Committee, University of
Alabama, 1992-93.
Elected Member of Faculty Senate, University of Alabama,
1992-93.
Elected as State Representative (Alabama) to the Southeastern
Division of the Association of American Geographers, 1992-94.
Member of Program Committee, 1993 AAG Annual Meeting in Atlanta,
Georgia, 1992-1993.
Member of Nominating Committee, Political Geography Specialty
Group, 1991-93
Member, Student Paper Award Committee, Political Geography
Specialty Group, Association of American Geographers, 1991-1992.
Chair 1987-1991.
Chair, Chair's Leadership Review Committee, Department of
Geography, University of Alabama, Spring 1991.
Member, Program Committee, SEDAAG Annual Meeting in Columbia,
South Carolina, Fall, 1990.
Judge for Rand McNally-NCGE "Excellence in Geography Teaching
Awards" for K-12th grade teachers, 1990.
Chair of the Region 2 Awards Committee, National Council for
Geographic Education, 1990; member 1988-89.
21
Elected Member of the Board of Directors, Political Geography
Specialty Group, Association of American Geographers, 1987-89.
Member of the International Studies Advisory Committee,
University of Wyoming, 1985-86, 1988-89.
Member of the Arts and Sciences Development Committee, University
of Wyoming, 1985-87.
REFEREE /REVIEW ACTIVITIES
Annals of the Association of American Geographers, 1989.
Florida Geographer, 1986.
Great Plains Research, 1996
Growth and Change, 1988, 1993.
Journal of Geography, 1997 (3).
National Endowment for the Humanities research proposal, 1996.
National Science Foundation research proposal, 1988, 1997.
Political Geography, 1989, 1990, 1991, 1993 (2), 1996 (2),
1997 (3).
Professional Geographer, 1984, 1985, 1986, 1989, 1991, 1992,
1993, 1994, 1995.
Social Science Journal, 1987, 1988, 1989.
Southeastern Geographer, 1984, 1992, 1994, 1996 (2).
Urban Geography, 1987 (2), 1990, 1991, 1993.
CLAG Yearbook, 1990, 1992.
Text Reviews: Harper and Row 1988, Wm. C. Brown 1990, John Wiley
1991, Guilford Publications 1995, Prentice-Hall 1995 (2),
1996 (2), 1997.
Outside Tenure and Promotion Referee, 1993.
MISCELLANEOUS SERVICE AT PROFESSIONAL MEETINGS
Session Chair: 1986, 1988, 1990, 1992, 1993, 1994, 1995, 1996,
1.997 {2}.
Session Organizer: 1988, 1992, 1993 (2), 1995 (5), 1996 (2),
1997 (3). ;
Paper /Session Discussant: 1989, 1991, 1993, 1995.
Panelist: 1993, 1996 (2).
2/98
UNITED STATES DISTRICT COURT
EASTERN DISTRICT OF NORTH CAROLINA
EASTERN DIVISION
Civil Action No. 4-96-CV-104-BO(3)
MARTIN CROMARTIE, THOMAS )
CHANDLER MUSE, and GLENNES )
DODGE WEEKS,
Plaintiffs,
Y.
JAMES B. HUNT, JR., in his official
capacity as Governor of the State of North
Carolina, et al.,
Defendants.
N
e
N
e
N
o
N
a
N
e
N
e
N
o
N
N
ADDITIONAL AFFIDAVITS FILED BY DEFENDANTS
RELATING TO PRELIMINARY INJUNCTION PROCEEDINGS
TAB
AFFIDAVIT OF CONGRESSPERSON WALTER B. JONES ........... 1
AFFIDAVIT OF CONGRESSPERSON SUEMYRICK ................ 2
AFFIDAVIT OF CONGRESSPERSON CHARLES H. TAYLOR ........ 3
AFFIDAVIT OF CONGRESSPERSON EVA M. CLAYTON 15. ies 4
AFFIDAVIT OF CONGRESSPERSON BOB ETHERIDGE ............ 5
AFFIDAVIT OF CONGRESSPERSON DAVID E. PRICE ............. 6
SECOND AFFIDAVIT OF GARY O. BARTLETT ....... 0 .cceveearan 7
d
3
1
0
A
0
3
H
LLa3
0150-222-008-1
“OO
A
T
d
d
N
S
T¥O3T
I
L
V
I
S
-
T
V
UNITED STATES DISTRICT COURT
EASTERN DISTRICT OF NORTH CAROLINA
EASTERN DIVISION
Civil Action No. 4-96-CV-104-BO(3)
MARTIN CROMARTIE, THOMAS )
CHANDLER MUSE, and GLENNES )
DODGE WEEKS,
Plaintiffs,
AFFIDAVIT OF
Vv. WALTER B. JONES
JAMES B. HUNT, JR., in his official
capacity as Governor of the State of North
Carolina, et al.,
Defendants.
N
e
’
N
a
e
N
o
N
e
N
a
N
e
N
a
N
a
N
e
N
e
N
e
Walter B. Jones, under penalty of perjury, deposes and says:
I. [ am a Member of the House of Representatives of the United States, elected from
the Third District. I was first elected in 1994, and was re-elected in 1996. I am a citizen and resident
of Farmville, in Pitt County, North Carolina. I am a registered voter over the age of eighteen and
competent to make this declaration stating facts of which I have personal knowledge.
4 I filed with the State Board of Elections during the filing period, which opened the
first Monday in January, 1998 and closed on the first Monday in February, by paying the filing fee
and giving Notice of Candidacy for re-election from the Third District.
3. I have no challengers for the Republican nomination. However, there are two
candidates in the Democratic primary for the Third District. The primary is scheduled for May 3,
1998.
4. It is not in the best interests of the citizens and voters of the State to enjoin the
impending elections and redraw the State’s twelve Congressional districts after decisions to run for
office have been made, campaigns have been organized, and campaigning has begun. The Third
District is necessarily a large district geographically because of the dispersion of the population in
the State’s Coastal Plain. Despite the size of the district, it is a logical district covering a large part
of the Coastal Plain, including counties along much of the State’s seacoast. If a new district is
created, it will be disruptive to the election process and confusing to voters. A significant
reconfigurationof the First District would have an equally significant impact on the Third District
and would result in moving a large number of voters into new districts. The district, which now
includes all of eleven counties and portions of seven other counties, will still cover a large number
of counties no matter how it is redrawn. However, the voters will have little opportunity to
familiarize themselves with their new districts and will be unfamiliar with the candidates. There will
be a significantly reduced opportunity for the voters to become knowledgeable about the candidates
and the issues which define and separate them.
5. A member is best able to represent those citizens he knows and those who live in his
community. I have represented the people of the Third District for more than three years and have
truly gotten to know them and what they want. They know me and what I represent. I know how
legislation will impact the people in my district and I fight for what is right by them. If the lines are
redrawn again at this late date, I would lose some of this familiarity with my constituents and thus
would be unable to represent them as well. With the 1997 changes it has been necessary to spend
time acquainting myself with the new district lines. Redrawing the district again means taking more
time to learn about the additions to the district and less time to help the people and the State.
2
oe tl
6, Any changes to the congressional elections now will require the Congressional
primary to be held as a special election with only Congressional candidates on the ballot. As a
result, turnout and participationin the election will be low, which negatively impacts the democratic
process and the legitimacy of the elections themselves.
Z. Stopping the election machinery already in progress is not in the best interests of the
citizens of the Third District. Voters will have less opportunity to be informed about the candidates
and many voters who are active in campaign efforts could find their time and interests in the political
process have been wasted on candidates who can no longer represent them.
Pursuant to 28 U.S.C. § 1746, I declare under penalty of perjury that the foregoing is true and
correct.
Executed on this 12 day of March, 1998.
Walter B. Jones
~
J
00
A
T
d
d
N
S
T¥HD3T
I
L
V
L
S
-
1
V
L
Q
3
0150-222-008
o» be
UNITED STATES DISTRICT COURT
EASTERN DISTRICT OF NORTH CAROLINA
EASTERN DIVISION
Civil Action No. 4-96-CV-104-BO(3)
MARTIN CROMARTIE, THOMAS )
CHANDLER MUSE, and GLENNES )
DODGE WEEKS,
Plaintiffs,
AFFIDAVIT OF
V. SUE MYRICK
JAMES B. HUNT, JR., in his official
capacity as Governor of the State of North
Carolina, et al.,
N
e
’
N
e
’
N
e
’
N
a
’
a
a
N
o
N
o
N
e
N
o
Defendants.
Sue Myrick, under penalty of perjury, deposes and says:
i; I am a Member of the House of Representatives of the United States, elected from
the Ninth District of North Carolina. I was first elected in 1994, and re-elected in 1996. I am a
citizen and resident of Mecklenburg County, a registered voter over the age of eighteen and
competent to make this declaration stating facts of which I have personal knowledge.
2 I am a candidate for re-election in the Ninth District and filed my Notice of
Candidacy with the State Board of Elections during the filing period for the 1998 election which
closed February 2, 1998.
5 J 3. I have an uncontested Republican primary, but there are two candidates running in
the Democratic primary for the Ninth District.
0 Me
4. With the May primary so close, it would be unduly disruptive to the election process
to halt the primary elections and require candidates, political and community leaders, and voters to
start all over again in making themselves knowledgeable about new districts. Political decisions and
strategies would have to be re-evaluated and citizens would have to familiarize themselves with new
districts and candidates.
Although no election has been held under the current plan, voters and candidates have
had since April, 1997, to become knowledgeable about the districts. Voters have been advised of
their new districts by their election boards or other sources. Voter lists are available to candidates
based on these districts.
6. Enjoining elections now is not only too disruptive to the election process, but is
unnecessarily confusing and frustrating to voters. At this late date, it would be difficult for voters
to become knowledgeable about the candidates and their districts. The voters would have little time
to inform themselves about the candidates and to readjust again to new district boundaries. If the
May primary is disrupted, a special election solely for Congressional elections would be required.
This will reduce voter participation.
7 The challenge to the Twelfth District, if successful, could require a substantial
alteration of the Ninth District and the other districts surrounding the current Twelfth District. This
would make it all the more disruptive to the candidates and confusing for the voting public. It is not
in the best interests of the election process to disrupt an election already well in progress.
a *
Pursuant to 28 U.S.C. § 1746, 1 declare under penalty of perjury that the foregoing is true and
correct.
Executed on this 14; day of March, 1998.
do Tupil
Sue Myrick
J
a
3
1
0
A
0
3
d
LLa3
0150-222-008-F
“OO
A
1
d
d
N
S
T
v
O
3
1
ILVLIS-TIV
» "
UNITED STATES DISTRICT COURT
EASTERN DISTRICT OF NORTH CAROLINA
EASTERN DIVISION
Civil Action No. 4-96-CV-104-BO(3)
MARTIN CROMARTIE, THOMAS )
CHANDLER MUSE, and GLENNES )
DODGE WEEKS, )
)
Plaintiffs, )
) AFFIDAVIT OF
v. ) CHARLES H. TAYLOR
)
JAMES B. HUNT, JR., in his official )
capacity as Governor of the State of North )
Carolina, et al., )
)
Defendants. )
Charles H. Taylor, under penalty of perjury, deposes and says:
1 [ am a Member of the House of Representatives of the United States, elected from
the Eleventh District of North Carolina. I was first elected in 1990, and have served continuously
since then. I am a citizen and resident of Transylvania County, a registered voter over the age of
eighteen and competent to make this declaration stating facts of which I have personal knowledge.
hy © I am a candidate for re-election in the Eleventh District and filed my Notice of
Candidacy with the State Board of Elections during the filing period for the 1998 election which
closed February 2, 1998.
3 I have an uncontested Republican primary and my opponent has an uncontested
Democratic primary.
a -
4. It would be unduly disruptive to the election process to halt the primary elections and
require candidates, political and community leaders, and voters to start all over again in new
districts. Political decisions and strategies would have to be re-evaluated and citizens would have
to familiarize themselves with new districts and candidates. New candidates may file, which could
result in a primary in the Eleventh District.
5. Although no election has been held under the current plan, voters and candidates have
had since April, 1997, to become knowledgeable about the new Eleventh District, which is
somewhat different from the previous district. Voters have been advised of their new districts by
sources such as newspapers and election boards. Voter lists are available to candidates based on the
new district boundaries.
6. Enjoining elections now is not only too disruptive to the election process, but is
unnecessarily confusing and frustrating to voters. The voters would have little time to inform
themselves about the candidates and to readjust again to new district boundaries. If the May primary
is disrupted, a special election solely for Congressional elections would be required. This will
reduce voter participation.
7 The challenge to the Twelfth District, if successful, could require a substantial
alteration of the other districts surrounding it. The ripple effect of such changes could substantially
impact the eastern boundary of the Eleventh District. This would be disruptive to the candidates and
confusing for the voting public. It is not in the best interests of the election process which has
already begun.
a "
Pursuant to 28 U.S.C. § 1746, I declare under penalty of perjury that the foregoing is true and
correct.
Executed on this 17] day of March, 1998.
Charles H. Taylor tekst)
a
3
7
0
A
0
3
4
a
3
UNITED STATES DISTRICT COURT
EASTERN DISTRICT OF NORTH CAROLINA
EASTERN DIVISION
Civil Action No. 4-96-CV-104-BO(3)
MARTIN CROMARTIE, THOMAS )
CHANDLER MUSE, and GLENNES )
DODGE WEEKS, )
)
Plaintiffs, )
) AFFIDAVIT OF
V. ) EVA M. CLAYTON
)
JAMES B. HUNT, JR., in his official )
capacity as Governor of the State of North )
Carolina, et al., )
)
Defendants. )
Eva M. Clayton, under penalty of perjury, deposes and says:
l. [ am a Member of the House of Representatives of the United States, elected from
the First District of North Carolina.
2. [ am a citizen and resident of Warren County, North Carolina, and a registered voter.
[ am over the age of eighteen and competent to make this declaration stating facts of which I have
personal knowledge.
3 I was first elected in November to serve in the First District in 1992, and was re-
elected in 1994 and 1996.
4, [ am a candidate for re-election in the First District and filed my Notice of Candidacy
with the State Board of Elections during the filing period for the 1998 election which closed
February 2, 1998. The Democratic nomination is being contested by one other candidate in the
primary election. Three candidates are competing in the Republican primary. The primary is
scheduled for May 35, 1998.
5. The 1997 Congressional redistricting plan has significantly altered the First District.
Large portions of Person, Granville, Vance, Martin, Edgecombe, Wayne, and Jones Counties have
been added to the district, while Chowan and Perquimans Counties, and large portions of
Pasquotank, Nash, Washington, Craven, Duplin, Pender, New Hanover, Columbus, Bladen and
Cumberland Counties, have been removed from the district. The district previously included nine
whole counties and portions of an additional nineteen counties, covering a total of twenty-eight
counties in the northeastern and southcentral areas of the Coastal Plain. The district now is centered
in the northeastern Coastal Plain, including ten complete counties and portions of ten counties.
6. Because of the substantial changes to the district, I began familiarizing myself with
the new areas and voters added to my district and organizing my campaign for re-election some time
ago. Making necessary contacts with the community and political leaders and politically active
voters in the new areas is crucial to my ability to campaign for re-election.
Zz. I began planning the strategy for my campaign in January of this year by identifying
the key campaign personnel, i.e. campaign manager, media consultant and fund raiser; identifying
the fundraising methods I plan to use; identifying means of informing voters of my views on
important issues; and deciding how to differentiate myself from my Democratic and Republican
opponents. Considerable energy and effort, including money, already has been expended on
announcing my candidacy, recruiting volunteers, rasing money and making campaign appearances.
8. Any significant changes in the First District boundaries at this stage of the election
process essentially would negate the efforts I and my supporters have made to date and require me
2
to start from the beginning. It is equally disruptive to the other four primary candidates, and could
result in a entirely different slate of candidates. This would be confusing and frustrating to the
voters.
0. Because of the rural and sparsely populated nature of the northeastern Coastal Plain,
any new district would still cover a large geographic area. For this reason, any current candidates
or potential candidates would need time to assess their support in a reconfigured district in terms of
fundraising, campaign work and votes. It would be necessary to assess the needs and interests of
voters from new areas. The decision whether to run for office is significantly more complicated
when a new district is drawn than the decision to run for re-election in the same district.
10. If the impending primary is disrupted, it will be much more difficult to attempt to
communicate with voters, disseminate information about the new districts and introduce a new slate
of candidates under a shortened election schedule. This will be confusing to voters who will have
little time to inform themselves about their districts, the candidates who are running, and the
differences between the candidates’ views on issues important to them.
11. A separate primary election under a shortened election schedule would not provide
much notice to voters and is a serious infringement on the democratic process because it likely will
severely reduce the number of citizens who actually vote and those who do vote will be less likely
to possess a sufficient level of information about the candidates and their views.
12. Congressional elections, unlike state legislative or local offices, involve districts with
more than half a million people. Reaching those people in a campaign for public office, especially
in a vast rural and sparsely populated area, takes time and money. Television, which is very
PY
o>
expensive, is the best means to inform the voters in a district like the First District. Candidates need
| time to raise the necessary funds to campaign effectively.
13. By traveling and campaigning throughout the First District, I have become familiar
with the district’s voters and their needs and interests. I have learned a great deal about the views
of all my constituents in this district regardless of race. It is my experience that the current First and
the new First District share needs and concerns related to the rural nature and economic poverty of
the region. These concerns transcend race and I work to represent the interests of all my
constituents. Currently, there are hundreds of active case files being serviced by my congressional
offices in the district and thousands of other case files where some action has been taken by my
offices for constituents of every race, color and creed. I represent the entire First District, not just
the minority voters in the district; I anticipate being responsive to the voters in new First District as
a whole. I intend to use my record of working for and serving all citizens in my current district in
my campaign for re-election in the new First District, a district with only the slimmest majority of
African-American voters.
14. Significant hardships will result to candidates and voters alike if the impending
primary is enjoined and an attempt to draw new districts is made at this late date. Those running for
election and voting in districts that are likely to have substantial changes will be the most severely
and adversely affected.
Pursuant to 28 U.S.C. § 1746, I declare under penalty of perjury that the foregoing is true and
correct.
Executed on this [0 day of March, 1998.
fl See
Eva M. Clayton
Subscribed i sworn (or affimed) to before
me this =< T_dayol Tif, 1924
C/o i
[ERRENCE ns
aR
iy Commission Expires February 28, 2000
a
3
1
0
A
0
3
H
L
a
s
UNITED STATES DISTRICT COURT
EASTERN DISTRICT OF NORTH CAROLINA
EASTERN DIVISION
Civil Action No. 4-96-CV-104-BO(3)
MARTIN CROMARTIE, THOMAS )
CHANDLER MUSE, and GLENNES )
DODGE WEEKS,
Plaintiffs,
AFFIDAVIT OF
Vv. BOB ETHERIDGE
JAMES B. HUNT, JR., in his official
capacity as Governor of the State of North
Carolina, et al.,
N
r
N
e
N
a
N
e
N
e
N
e
N
e
N
a
N
N
N
N
Defendants.
Bob Etheridge, under penalty if perjury, deposes and says:
lL. I am a registered voter over the age of eighteen and competent to make this
declaration, stating facts of which I have personal knowledge.
2. [ am a Member of the House of Representatives of the United States elected from
the Second District of North Carolina. I was first elected in 1996.
3. I a a candidate for re-election in the Second District and filed my Notice of
Candidacy with the State Board of Elections during the filing period for the 1998 election which
closed February 2, 1998.
4. I am the only candidate in an uncontested Democratic primary, but there are two
candidates running in the Republican primary for the Second District.
5. Although the core of the Second District remains much the same, the 1997 redrawing
of congressional districts did make some significant changes to the district. Large portions of Wake
and Sampson Counties have been added to the district, while large portions of Moore, Halifax,
Edgecombe and Vance Counties have been removed from the district. I have already adjusted my
re-election campaign to accommodate these changes.
6. Although I do not have a contested primary, I began organizing my campaign for re-
election some time ago. The re-election process, which includes organizing, recruiting volunteers,
fundraising and making campaign appearances, already has begun. Much of my campaign strategy
already has been planned and now is being implemented. This includes focusing on distinguishing
myself from the Republican challengers and taking into account the knowledge I have acquired
about the interests and views of the citizens and voters in my district. It would be a hardship to my
campaign and all of the people who contribute their time, money and efforts to my campaign if the
election now in progress were enjoined and new districts created.
7. With the May primary so close, it would be unduly disruptive to the election process
to halt the primary elections and require candidates, political and community leaders, and voters to
start all over again in making themselves knowledgeable about new districts. Political decisions and
strategies would have to be re-evaluated and citizens would have to familiarize themselves with new
districts and candidates.
8. Although no election has been held under the current plan, voters and candidates have
had since April, 1997, to become knowledgeable about the districts. Voters have been advised of
their new districts by their election boards or other sources. Voter lists are available to candidates
based on these districts.
0, Enjoining elections now is not only too disruptive to the election process, but is
unnecessarily confusing and frustrating to voters. At this late date, the voters would have little time
to inform themselves about the candidates and to readjust again to new district boundaries. If the
May primary is disrupted, a special election solely for Congressional elections would be required.
This will reduce voter participation.
10. The challenge to the First District, if successful, could require substantial alterations
of the districts surrounding it, including the Second District which shares its northern and eastern
boundaries with the First District. This would make it all the more disruptive to the candidates and
confusing for the voting public. It is not in the best interests of the election process to disrupt an
election already well in progress.
Pursuant to 28 U.S.C. § 1746, I declare under penalty of perjury that the foregoing is true and
correct.
Executed on this 2 day of March, 1998.
Vo Gestict,
Bob Etheridge
~
J
UNITED STATES DISTRICT COURT
EASTERN DISTRICT OF NORTH CAROLINA
EASTERN DIVISION
Civil Action No. 4-96-CV-104-BO(3)
MARTIN CROMARTIE, THOMAS )
CHANDLER MUSE, and GLENNES )
DODGE WEEKS, )
)
Plaintiffs, )
)
v. ) AFFIDAVIT OF
) DAVID E. PRICE
JAMES B. HUNT, JR., in his official )
capacity as Governor of the State of North )
Carolina, et al., )
)
Defendants. )
David E. Price, under penalty of perjury, deposes and says:
lL. I am a registered voter over the age of eighteen and competent to make this
declaration, stating facts of which I have personal knowledge.
0 I am a member of the House of Representativesof the United States elected from the
Fourth District of North Carolina.
3. I was first elected to serve the Fourth District and served from 1987 through 1992,
when the district included Randolph, Chatham, Orange, Wake and Franklin Counties. I was re-
elected in 1992, when the Fourth District was redrawn after the 1990 Federal Census to include
Chatham, Orange and Wake Counties. I lost the General Election in 1994, but was re-elected in
1996.
4. [ am a candidate for re-electionin the Fourth District as redrawn in 1997. I filed my
Notice of Candidacy with the State Board of Elections during the filing period for the 1998 elections
which closed February 2, 1998. The Democratic nomination is being contested by one other
candidate in the primary election. The Republican candidate is uncontested in the primary. The
primary is scheduled for May 35, 1998.
5. The 1997 Congressional redistricting plan has significantly altered the Fourth
District. The eastern one-half of Wake County and a small portion of Chatham County have been
removed from the district. Orange County remains in the district, but all of Durham County and a
large portion of Person County have been added to the district.
6. Because of the substantial changes to the district, I began familiarizing myself with
the new areas and voters added to my district and organizing my campaign for re-election some time
ago. The re-election process, which includes organizing, recruiting volunteers, fundraising and
making campaign appearances, has already begun. Because of the changes which have been made
to the Fourth District over the years, I am familiar with the organizational efforts necessary to adjust
to campaigning in a reconfigured election district.
7. My campaign strategy for the primary has already been implemented and much
planning for the general election has already taken place, assuming a victory in the primary. This
includes distinguishing myself from my challenger in the primary, and also from the Republican
candidate, taking into account the knowledge I have acquired about the voters who remain in the
district and the new voters from the counties added to the district. Grassroot outreach efforts have
long been an important part of my campaign efforts. In the past, this has included nightly walks in
neighborhoods going door to door and meeting in people’s houses. Many of my campaign activities
2
to date would be nullified if the current election is enjoined and a new districting plan imposed,
especially if any portions of the district are removed. I would have to start from scratch if new
counties were included in the district.
8. With the primary election at hand, it would be too disruptive to the ongoing election
process if the primary election was enjoined and if candidates, political and community leaders, and
voters were required to start the process all over again. Candidates would need time to decide
whether to run; political decisions, strategies and endorsementsall would have to be re-assessed; and
citizens and political activists would have to familiarize themselves with new districts and quite
probably new candidates.
9, Although no election has been held under the current plan, voters and candidates have
had since April, 1997, to adjust to and inform themselves based on the new congressional
boundaries. Voters have been advised of their new district by their election boards or other sources.
As an incumbent candidate, I have already made the necessary political and organizational changes
to reflect the 1997 redistricting changes. Changing Congressional districts again, after the election
process has already begun, will not only disrupt my efforts, but can be only more confusing and
frustrating to voters and supporters.
10. Enjoining the congressional election at this late date would require the Congressional
election to be held as a special election with only Congressional candidates on the ballot. This
traditionally produces extremely low voter turnout and participationin the election. Such results are
detrimental to the democratic election process.
11. The legal challenges to the First and Twelfth Districts, if either is successful, likely
would result once again in substantial changes to the Fourth District. Although the Fourth District
3
was not at issue in the redistricting litigation, it was an area which received intense debate in the
legislature and was substantially reconfigured in the 1997 Plan. Redrawing the district again would
be disruptive to the election process and unnecessarily confusing to the voting public. It is not in
the best interest of the voters for the election already in progress to be halted.
Pursuant to 28 U.S.C. § 1746, I declare under penalty of perjury that the foregoing is true and
correct.
I a
Executed on this (Fay of March, 1998.
/
WAI
David E. Price
ONE
UNITED STATES DISTRICT COURT
EASTERN DISTRICT OF NORTH CAROLINA
EASTERN DIVISION
Civil Action No. 4-96-CV-104-BO(3)
MARTIN CROMARTIE, THOMAS )
CHANDLER MUSE, and GLENNES )
DODGE WEEKS,
Plaintiffs,
AFFIDAVIT OF
v. GARY O. BARTLETT
JAMES B. HUNT, JR., in his official
capacity as Governor of the State of North
Carolina, et al.,
N
e
’
N
e
’
N
a
’
N
e
N
a
N
e
N
a
N
a
N
o
N
e
N
S
Defendants.
Gary O. Bartlett, being duly sworn, deposes and says:
1. He is Executive Secretary-Director of the North Carolina State Board of Elections
and has those duties prescribed by law.
2 The filing period for candidates seeking party nominations for the House of
Representatives of the United States opened at 12:00 noon on January 5, 1998, and closed at 12:00
noon on February 2, 1998. The filing period for all other federal, state and local offices with 1998
elections opened and closed at the same as that for the House of Representatives of the United States.
State Board of Elections ballots for the May 5, 1998 primary will include candidates for U.S. Senate,
U.S. House of Representatives and the Supreme Court of North Carolina.
~
3. On February 5, 1998, the State Board certified the name, address and party affiliations
of each person who filed to run for election in the House of Representatives of the United States.
Thirty-one candidates filed for the twelve congressional seats and contested primaries will be held
in eight of the twelve congressional districts. A list of the candidates is attached as Exhibit A.
4. The State Board of Elections designs and lays-out the ballot for elections for the
United States House of Representatives or approves the design and lay-out of ballots by county
boards of elections. The State Board has ballots printed for a number of counties that still vote by
paper ballot and other voting machine counties that use its paper ballot for absentee, provisional or
curbside voting. The State Board's contracts for printing primary ballots has been awarded and the
final proof of the ballots was approved March 6, 1998.
5. The State Board and county boards of elections must complete the process of
approving, printing and distributing primary ballots by March 16, 1998, when absentee voting
begins. State law requires that persons entitled to vote by absentee ballots must be furnished with
regular official ballots.
6. The State Board and county boards of elections usually have about six weeks from
the close of the filing period to the beginning of the absentee voting period to complete the process
of designing the ballots, choosing ballot colors (the ballots for the respective political parties in the
primary are printed on different colored paper), correcting and returning proofs, having ballots
printed and distributing the ballots. The number of primary ballots printed and available for each
party primary must be at least equal to the number of registered voters affiliated with the party plus
the number of unaffiliated voters registered in the county.
y First notice of the primary election and registration deadline must be published in
local newspapers by March 21, 1998. This is also the last day to publish changes of precinct or
voting places. April 4, 1998, is the last day to publish the third and final notice of election and
2
registration deadline for the primary. The last day to register to vote for the May primary is April
10, 1998, when the registration books close.
8. It would not be possible to hold the primaries as scheduled on May 5, 1998, if
congressional districts were redrawn and a new candidate filing period allowed. There is not
sufficient time to allow candidates to file, to design, print and distribute ballots, and to conduct
absentee voting before the scheduled primary.
9. Boards of Elections have been working since October, 1997, to update records
indicating to which districts voters are assigned and most counties have sent out voter identification
cards identifying congressional districts. District voter lists also are made available to candidates.
If a new congressional districting plan was adopted and put into effect, some period of time between
its adoption and the opening of a new filing period would be necessary to allow county boards of
election to make adjustments to place voters in the correct districts, inform voters of their new
districts, and to allow candidates to make decisions about filing for office based on the
reconfigurations of the districts.
10. Provisions for absentee voting are an important part of the election process. Failure
to provide an adequate time for absentee voting would deprive substantial numbers of voters,
especially persons in military service, elderly persons in nursing homes and other persons who are
handicapped, a meaningful opportunity to vote. The 50 day time period for absentee voting is
necessary to accommodate the time required for voting by citizens assigned to duty out-of-state or
overseas by Department of Defense agencies. Reducing the time would make the absentee voting
process meaningless and would likely generate vigorous objections by the United States
Deparatment of Defense. Generally, about 3% to 4% of ballots cast in any election are by absentee
voting, a number which seems to be increasing.
LL Past experience by the State Board of Elections has demonstrated that special, single-
office primary or general elections normally attract much smaller voter turnouts than regularly-
scheduled elections or primaries in which voters cast ballots simultaneously for candidates for all
offices up for election that year. Historically, North Carolina has held its primaries in the spring and
only once, in 1976, voluntarily scheduled a primary as late as August. That experiment lasted for
the one primary election and was never repeated by the legislature, although a fall primary on
occasion has been debated.
12. The State Board and county boards of elections would incur significant costs if the
impending primary elections were disrupted, new congressional districts adopted, and a separate
primary election required. A statewide election, primary or general election, costs approximately
$4,300,000. This includes primarily the costs of printing ballots, paying for polling places, paying
precinct officials and programing election machines. There are approximately 2,500 precincts, each
of which must be staffed with a minimum of three people. If a primary is not necessary in four of
twelve districts, the cost would be reduced. The amount of the reduction would be determined to
a great extent by which districts no longer require a primary.
13. For the campaign reporting period covering July 1, 1997 through December 31, 1997,
nineteen congressional candidates filed campaign finance reports showing contributions totaling
$3,164,419 and expenditures totaling $1,526,452.
HK
This the /O ~ day of March, 1998.
Sworn to and subscribed before me this
/6”% day of March, 1998.
/]
ance / (ora
Wotary Public /
My commission expires: /2 - 20-99
7
Gary O. Bartlett, Executive Secretary-Director
of the North Carolina State Board of Elections
EXHIBIT A
1998 CANDIDATES FILING FOR
U.S. HOUSE OF REPRESENTATIVES
DEMOCRAT
FIRST DISTRICT
Eva M. Clayton (D)
Linwood E. Mercer (D)
SECOND DISTRICT
Bob Etheridge (D)
THIRD DISTRICT
Sheppard Neal Moore (D)
Jon Williams (D)
FOURTH DISTRICT
Ralph M. McKinney, Jr. (D)
David E. Price (D)
FIFTH DISTRICT
SIXTH DISTRICT
REPUBLICAN
Duane E. Kratzer, Jr. (R)
Jerome Power (R)
Ted Tyler (R)
Dan Page (R)
Richard D. Skilten (R)
Walter B. Jones (R)
Tom Roberg (R)
Richard M. Burr (R)
Howard R. Coble (R)
SEVENTH DISTRICT
Randy Crow (D)
Mike Mcintyre (D)
EIGHTH DISTRICT
Glenn Jernigan (D)
Mike Taylor (D)
NINTH DISTRICT
Rory Blake (D)
Jordan Bonner (D)
TENTH DISTRICT
ELEVENTH DISTRICT
David Young (D)
TWELFTH DISTRICT
Mel West (D)
Anna Taylor Stewart (R)
Robert C. Hayes (R)
Sue Myrick (R)
T. Cass Ballenger (R)
Charles H. Taylor (R)
Scott Keedle (R)
John J. Kozlowski, Jr. (R)