Expansion of Civil Rights Legal Platform (Telegram)
Press Release
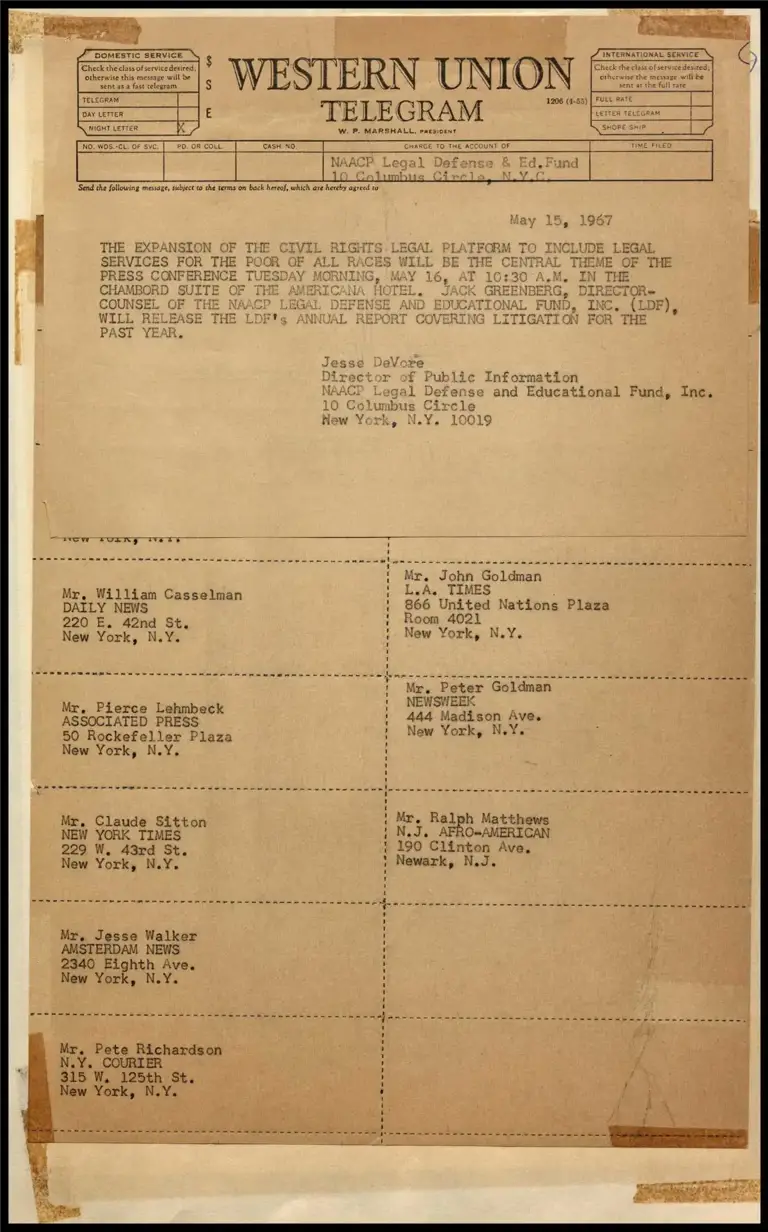
May 15, 1967
Cite this item
-
Press Releases, Volume 4. Expansion of Civil Rights Legal Platform (Telegram), 1967. 3a7550d1-b792-ee11-be37-00224827e97b. LDF Archives, Thurgood Marshall Institute. https://ldfrecollection.org/archives/archives-search/archives-item/d796d989-088c-482a-9970-f8447925411c/expansion-of-civil-rights-legal-platform-telegram. Accessed July 07, 2026.
Copied!
    J” Domestic SERVICE $ 3
Check the class ofservicedesired; S | R \ \ ION
otherwise this message will be W k | f l \ | \

sent as a fast telegram $ \ N

a TELEGRAM =“
PN NIGHT-LETIER fy W. P. MARSHALL, pacsioenr

[Rowos-cuor sve | Po oncom. | CASH NO T CHARGE TO THE ACCOUNT OF

N. P. Legal De
10 Colimbirs

Send the following message, subject to the terms on back hereof, which ave hereby agreed co

UDE LEGAL
OF THE

THE EXPANSION OF TI
SERVICES oe THE P

Information
e and Educational Fund, Inc.

W SUE Gg ts 5s

Mr. John Goldman
‘ L.A. TIMES W. '

DAILY EAS" ee ' 866 United Nations Plaza
+ Room 4021 220 E. 42nd St,

New York, N.Y. New York, N.Y.

Mr. Peter Goldman
NEWSWEEK
444 Madison Ave.
New York, N.Y.

Mr, Pierce Lehmbeck
ASSOCIATED PRESS
50 Rockefeller Plaza
New York, N.Y.

Mr, Ralph Matthews
N.J. AFROAMERICAN
190 Clinton Ave,
Newark, N.J.

Mr. Claude Sitton
NEW YORK TIMES

229 W. 43rd St.
New York, N.Y.

Mr, Jesse Walker
AMSTERDAM NEWS

2340 Eighth Ave.
New York, N.Y.

R
i
s


wi
e

a
e
e
e


Gh


s
Aa
e
t
a
l
e
s


Mr. Pete Richardson
«Y. COURIER

315 W. 125th St.
New m York, N.Y.


3138 eae 021 p on are rey ea, mens we 9 ‘soe s9 nine mont pee 0 SAFE gerozoun Rajow0} 9m AaBANDD oh WWE ob.Gh pervs oleae MANSON TO OUDDA
Meeoolsey tnt CIN) H34131 LHOIN

rs ie se ean tenia ‘nore: mot 31 soon cpu pasiNO6 ¥
GQ) Wvsoa738L 83113 Gang aes)

id OE
10 $5080) exo ofunsuvy uv uy 40 “odo “opoo aT uOII}La oq AUF ~eoIAz08

Wayaive vind

S3OIAUSS WWNOILYNYSLNI SaDIAKAES DILSZINOG

BOIAYAS AO SASSV19

oouapias qumadmoD £4.
OTOL, 84 £4 DOHOE LUV 0g 1Imys toszaNp AUoAtI9p pu uopReUEETTT o9sI09 PAY IduIOAd BNA SOAUEOTH 40 oHvSsON KUT 20] SIIOr oN AAddeI OY SUNAMOD YAv

stiopeormim0S OW: 4oy stump 63 ida ao ene mortpog era uu “3943
ale ous wo at iy aa at

“i
tee oe uray (8)

spout smn “orn
%q ooo yon

9 30 Ha 3} ORANED pHHOPIDpY Ons oat 30
tans puedo at i Uy dujod av 02 Pou ap oseemn Wao soaaNID Bes IGwaIdE ONAL

‘nonemep
ouL 't

punisi peo a
goaanaicl 8, 8irod Ho Wodsous 8 Audio OUBOIO,

‘yo|s00}109 a2 Box Soop shut) 1a
IMI, AOAqTop $3)

qi0 Atco Jo sony] om 2040 aseeromE MINE DIVO} 04 “IMAM ARONA ‘zopUOS O47 Jo JuOR” OND apMiaa AqazoN s} A $31 oar 04 Arvscooo wora <uedet09
Hr 20 natMA-ow Ot

dtluaome-porvodt
Saeco [00 soy woyat ose: reurep 30} viquil aq 200

va sqripods ssoran p29 Saas 20) 44

0 staat ono}
2eu19p 405 OMY Sum My dom Spar Hh Ho works ha 30 1 30

spanvodas om av uoTs Tpowvodauun buy 3 Wop
10% 909 PaOsKE ef 3} JOON YoLes9pTEOO MH "NORE su 405 pint puY Aen poreadasun es sIMd ‘sON} say WO Porvo:pAT astaaD STA CO Sus sivaesuo ‘qua ueul uomvauoD 20) o9q0 Hufiwuysyio aul oy Ava poudwtafen a] uN Sporvedsd Hy Japse pinoys oes v yo dopaay oN Ss

'SIWYSL ONIMO1104 SHL OL LOAPENS SYW ANWdINOOD SIHL Ad NAWVL SADVSS3W WIV

ery
pret os

Mr, Elliot Ogden
MANHATTAN EAST

1503 Third Ave,

ir. Dave Spengler
ys HE RECORD ‘

lackensack, N.J.
1 New York, N.Y.

Mr. Fred Winshi
UNITED PRESS INTERNATIONAL
20 E. 42nd St.
ew York, N.Y.

}
| '

| Mr. H, L. Stevenson
| UNITED PRESS INTERNATIONAL :

220 E, 42nd St, ' Z
N


New York, N.Y.

Mr, Austin Scott
ASSOCIATED PRESS

0 Rockefeller Plaza
Mr, John Bott
City Editor ; 5
N.Y, POST | New York, N.Y.
75 West Street H
New York, N.Y. '

: Mr. John Goldman
Mr, vee Casselman | L.A, TIMES
DAILY NEW: | 866 United Nations Plaza
220 E, pol St. ' Room 4021
New York, N.Y. t New York, N.Y.

mga hs catalnsoue
! Mr. Peter Goldman
» NEWSWEEK Mr, Pierce Lehmbeck

ASSOCIATED PRESS

50 Rockefeller Plaza
New York, N.Y.

444 Madison Ave.
New York, N.Y.

Mx. Claude Sitton Mr, Ralph Matthews
NEW YORK TIMES i »_AFRO“AMERICAN
229 W. 43rd St. oo Clinton Ave,
New York, N.Y. Newark, N.J.

Mr. Jesse Walker
| AMSTERDAM NEWS

Feusty Eighth Ave,
New York, N.Y.

N.Y. CO
315 W. 125th St.
New York, N.Y. }

Mr. Pete Richardson
OURIER

aeirrinias