Statistics on Life Values in North Carolina by County
Working File
January 1, 1980
Cite this item
-
Case Files, Thornburg v. Gingles Working Files - Guinier. Statistics on Life Values in North Carolina by County, 1980. bda741db-dd92-ee11-be37-6045bdeb8873. LDF Archives, Thurgood Marshall Institute. https://ldfrecollection.org/archives/archives-search/archives-item/03e7a5e0-09b1-405e-b5c2-f8d22c749125/statistics-on-life-values-in-north-carolina-by-county. Accessed July 08, 2026.
Copied!
61. For statistics which use white and non-white, non-
white is over 952 black in North carolina. source: North
Carolina Department of Human Resources.
62. Infant mortality rates in North Carolina are
substantially higher for non-whites than for whites. For
the five year period from L976-1980 the infant morraliry
rate by race was as follows:
Fetal1 Neonatal2 Post Neonatal3
trIhite 9:4
Non-l^lhite L6.9
1. The fetal death rate is the number of non-
abortion fetal deaths after 20 weeks gestation per
1000 live births plus feral dearhs.
2. The neonatal death rate is the number of
deaths from birth to 28 days per 1000 live births.
3. The post neonatal death rate is the number
of deaths from 29 days ro 1 year per 1000 l-ive births
that attained the age of 29 days.- This is a four
year rather than a five year measure.
(Source: "Maternal and Child Care Statistics in
North Carolina over the l-ast Decade, " North Carolina
Department of Human Resources, Spring 1981. )
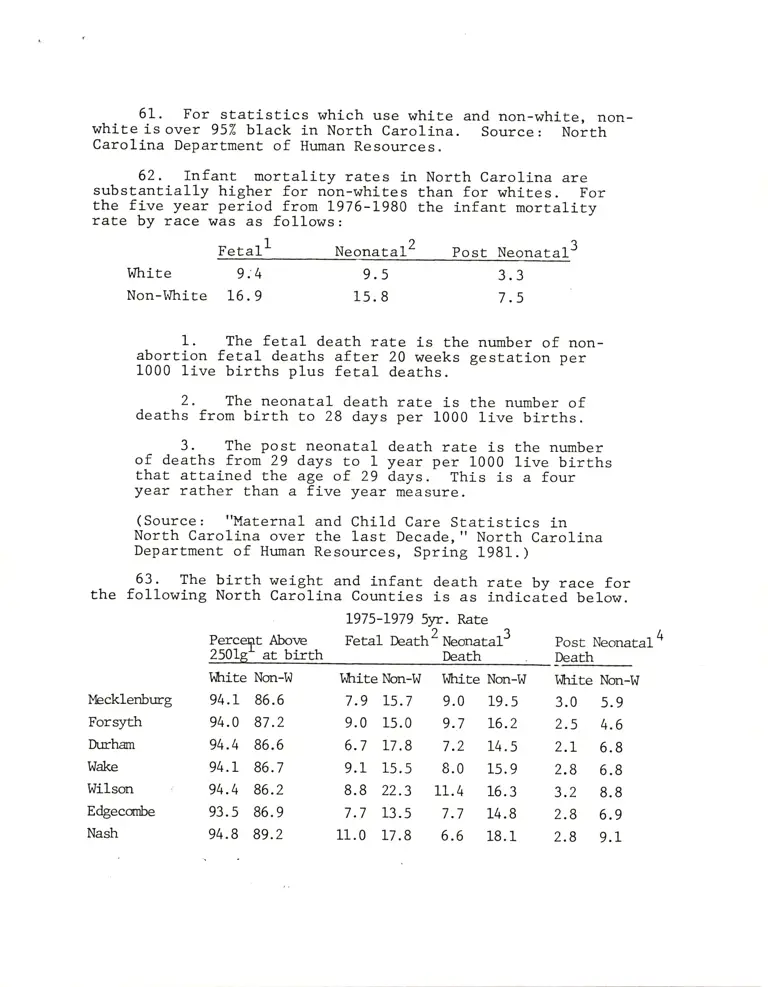
63. The birth weight and infant death rate by race forthe following North carolina counties is as indicaled below.
9.5
15. 8
3.3
7.5
L975-L979 51r. Rate
Percqrt Aborre Fetal Death2 wec,natal3
2501g' at birth Death
Post Neonrtrl4
@__
Vtrite Ncrn-tri
l&cklenbr-rg 94.L 86.6
Forsyth 94.0 87.2
Dl;rrhan 94.4 86.6
94.L 86.7
94.4 86.2
93.5 86.9
94.8 89.2
I,iLrite lqon-W l^lhite Ncrn-W I,JLrite Non-W
7.9 Ls.7 9.0 19. s 3.0 s.9
9.0 1s.0 9.7 L6.2
6.7 17.8 7.2 14.s
9.L 15.s 8.0 1s.9 2.8 6.8
8.8 22.3 11.4 16.3 3.2 8.8
7.7 13.5 7.7 14.8 2.8 6.9
2.5 4.6
2.L 6.8
Wake
Wilscn
Edgeccrnbe
Nash 11.0 17.8 6.6 18.1 2.8 9.L
1. It is considered healthy for a baby to weigh
more than 2501 grams at birth.
2. The fetal death rate includes deaths after
20 weeks of gestation excluding abortions.
3. The neonatal death rate includes deaths
from birth to 28 days.
4. The post-neonatal death rate includes deaths
from 29 days to one year.
Source: "Maternal and Child Health Statistics, " North
Carolina Department of Human Resources, L979
64. The death rate for pon-whites in North Carolina
is higher than the death rate'for whites. For example,
the age-adjusted mortality rate for L978 was:
I^lhite Non-White
male 9L6.9 LL92.5
female 453.7 621.8
1. Deaths per 100,000 popularion adjusred for
age. Source: "North Carolina Health Statistics
Pocket Guide" February L982, North carolina Department
of Human Resources.
65. "Analysis of age-adjusted death rates for race-sex
groups reveals wide gaps between races and also between sexes,
more so in North carolina than nationwide." "North Carolina
Health Statistics Pocket Guide," lrlc Deptarunant of r-r-man Resortrces,April 1981.
The following table shows life expectency ia L973 and, Lg74.
Table A
Selected Life Table yllues, by Age,
North Carolina, igZ3 anO
Color and Sex:
t974
NON-l.lHITE
Expectation of Life:
At Birth
7973
1974
At Age I
t973
1974
At Age 25
t973
7974
At Age 65
1973
1974
68.90
69.87
69.32
70 .16
46. 64
47.30
13.95
t4.?3
66.68
67.54
66. 91
67.77
44.37
44.99
1?.32
L2.56
74.70
75.44
74.88
75.40
51. 67
5?.L4
15.88
16.07
59.06
60.13
59.86
60.74
37.92
38.48
11.61
11. 89
67.56
69.04
68.32
69.59
4s.43
46.67
13. 9s
14.49
Percent Survi ving
From Bi rth:
To Age I
t973
t974
To Age 25
Lg73. t974
To Age 65 .*73
t974
97.97
98. 19
95. 69
96.21
68. 61
70.51
98.19
98.20
9s.49
95.99
63.17
65. 13
98.44
98. 75
97 .21
97.59
82.03
83.35
97.04
97.38
92.79
93.74
44.99
46. 16
97.45
97.79
95.56
95.96
65.05
68.46
l',ledian Age at Death:
t973
t974
72.07
73.5 r
source: "North carolina Life Tables for L973 and L974,:North carolina Department of Human Resources, Ju1y, Lg75.
66. rn February 1980, a report prepared by the NorthCitrolina Community Development Councii fbr the i{orth Carolina
Department of Natural Resources and community Developmentconcluded, "There are a number of deterrents to a successfurhousing-pr-ogram in North Carolina,- but three or. *o"i orrtstanding.one is lack of knowledgq about Fe:dera1 and stiiu rro""i"g p;;F;;:A second is economic and racial prejudice. The third hls^ to"do
with the availabiliay of money, what it takes to abtain it, andthe overall cost of construction. " From "Housing-f;; Northcarolinians : Policy and Action Reconrnendations"]
67 . rn the spr-i_ng of 1981, the Norrh carolina HousingFinance Agency, the united states secretary of Housing and"urban Development, and the united states slcretary oi"trreTreasury identified 24 urban census tracts which ir.=" e1-igiblefor loans under the Mortgage subsidy Bond Tax Act. Thecriterian is that 707" or more of tha families have incomeswhich are 807. or l-ess of the statewide median family income.
-of t!," 48,562 -people |1ving in these census tracts 39,369 wereblack compared to 8,814 white . and L74 indian. The tractseligible for targetting are as follows:
Table 10
NORTH CAROLINA CENSUS TRACTS ELIGIBLE FOR TARGETING
County No. Tract Cor-nrty 1980 l^thite
Total Pop.
Black American
Indian
2L
51
51
51
51
63
63
65
67
67
81
119
119
119
119
2.00
1.00
2.00
3.00
13.00
12.01
t2.02
201.00
5.00
8.02
108.01
4.00
5.00
7.00
8.00
2t73
100s
2787
L482
2269
864
976
401
27t8
3065
703
623
1901
757
3346
557
44L
487
449
77
9
1
34
23
710
459
338
1608
523
2249
9s8
2L86
859
975
367
2689
2309
22L
28t
1 825
565
3246
Br:ncombe
Cr.rmberland
Cumberland
Cr-rmberland
Cr:nberland
Durham
Durham
Edgecombe*
Forsyth
Forsyth
Guilford
Mecklenburg
Mecklenburg
Meeklenburg
Mecklenburg
66
90
95
7
34
48
0
2
0
0
0
4
t7
t4
3
3
0
0
Table 10
NORTH CAROLINA CENSUS TRACTS ELIGIBLE FOR TARGETING
County No. Tract Cornty 1980 l.lhite
Total Pop.
Black American
Indian
119
119
t29
L29
L29
183
-
19r.
191
195
2562
.'2t5
3755
^1381
L675
4033
30.0 7
. 567
6297
6
0
t32
L024
5
118
26s8
27t
773
2547
2L5
3607
351
1555
3904
".3.37
258-
5514
37.00 Mecklenburg
49.00 Mecklenburg
111.00 New Hanover
113.00 New Hanover
114.00 New Hanover
9.00 Wake
10.00 Wayne*
17.00 Wayne*
8. O0 I^Iilson*
0
0
L2
5
4
5
4
1
4
24 census tracts 48562 8814 39369 L74
:k Not in an SMSA
Source: Interrogatory lt3l 1'Complying with the Mortga1e Subsidy
Bond Tax Act of 1980: A Preliminary Analysis for the North
Carolina Housing Finance Agency" at Table 10).