Correspondence from Whelan to Stone and Tegeler Re: Dr. Armor Study
Correspondence
November 3, 1992
5 pages
-
Case Files, Sheff v. O'Neill Hardbacks. Correspondence from Whelan to Stone and Tegeler Re: Dr. Armor Study, 1992. b995e0cc-a246-f011-8779-7c1e5267c7b6. LDF Archives, Thurgood Marshall Institute. https://ldfrecollection.org/archives/archives-search/archives-item/0fc43515-bb1e-4945-aae4-1d548dce683f/correspondence-from-whelan-to-stone-and-tegeler-re-dr-armor-study. Accessed October 21, 2026.
Copied!
    MacKenzie Hall

110 Sherman Street

Hartford, CT 06103

RICHARD BLUMENTHAL
ATTORNEY GENERAL


FAX (203) 523-5536

Office of The Attorney General Tel

State of Connecticut
3% 566-7173

November 3, 1992

Martha Stone, Esq.
Philip Tegeler, Esq.
Connecticut Civil Liberties Union

32 Grand Street

Hartford, CT 06106

RE: SHEFF v. O'NEILL/DAVID ARMOR


Dear Martha & Phil:

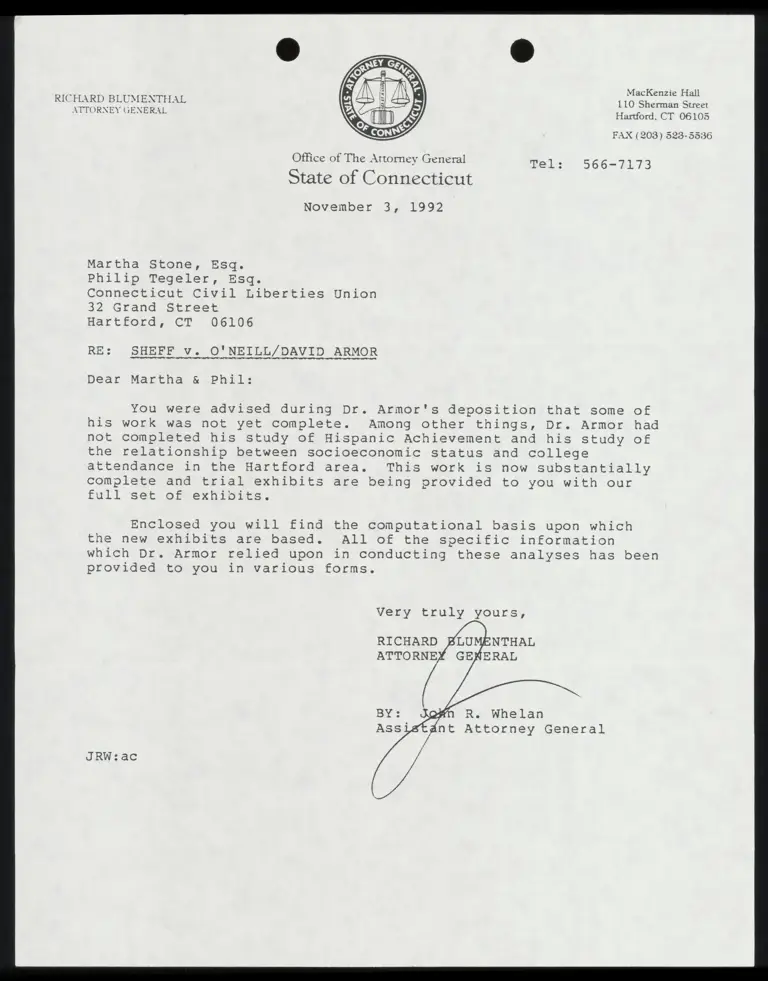
You were advised during Dr. Armor's deposition that some of
his work was not yet complete. Among other things, Dr. Armor had
not completed his study of Hispanic Achievement and his study of
the relationship between socioeconomic status and college
attendance in the Hartford area. This work is now substantially
complete and trial exhibits are being provided to you with our
full set of exhibits.

Enclosed you will find the computational basis upon which
the new exhibits are based. All of the specific information
which Dr. Armor relied upon in conducting these analyses has been
provided to you in various forms.

Very truly yours,

JRW: ac


ACHIEVEMENT ANALYSIS FOR HISPANICS, FULL SAMPLE

TOTAL OBSERVATIONS:

N OF CASES
MINIMUM
MAXIMUM
MEAN
STANDARD DEV

N OF CASES
MINIMUM
MAXIMUM
MEAN
STANDARD DEV

TOTAL OBSERVATIONS:

N OF CASES
MINIMUM
MAXIMUM
MEAN
STANDARD DEV

N OF CASES
MINIMUM
MAXIMUM
MEAN
STANDARD DEV

S7

10.100
47.000
23.846
10.923

HARTFORD HISPANIC

READP MR

671 656
26.461 32.000
40.491 140.000
34.809 80.694
4.474 22,436

SF BI

671 671
51.000 0.000
51.000 1.000
51.000 0.775
0.000 0.418

SUBURBAN HISPANIC

READP MR

97 96
34.969 35.000
51.553 137.000
44.662 91.990
3.552 22.074

ST BI

97 97
5.600 0.000

19.700 1.000
13.806 0.990
4.372 0.102

MATHP SES

671 671
68.521 0.000
88.991 1.000
80.749 0.747
6.542 0.435

MATHP SES

97 : 97
77.142 0.000

101.342 1.000
91.263 0.351
5.090 0.480


“a    ® »
>SELECT PC=0

>MODEL RR=CONSTANT+HP+SES+BA+SF+Bl

>EST

28 CASES DELETED DUE TO MISSING DATA.

DEP VAR: RR N: 4378 MULTIPLE R: .590 SQUARED MULTIPLE R: .348

ADJUSTED SQUARED MULTIPLE R: «347 STANDARD ERROR OF ESTIMATE: 12.009

VARIABLE COEFFICIENT STD ERROR STD COEF TOLERANCE T P(2 TAIL)

CONSTANT 44.423 1.368 0.000 . 32.463 0.000

HP -10.431 0.878 -0.265 0.300 =-11.879 0.000

SES -4.838 0.692 -0.119 0.514 -6.994 0.000

BA 0.194 0.021 0.146 0.604 9.321 0.000

BI 9.192 1.092 0.113 0.830 8.418 0.000

ANALYSIS OF VARIANCE

SOURCE . SUM~-OF-SQUARES DF MEAN-SQUARE F=RATIO P

REGRESSION 335911.642 5 67182.328 465.871 0.000

RESIDUAL 630476.952 4372 144.208

Press ENTER <=' or RETURN

>EST

43 CASES DELETED DUE TO MISSING DATA.

DEP VAR: MR N: 4363 MULTIPLE R: .510 SQUARED MULTIPLE R: .260

ADJUSTED SQUARED MULTIPLE R: .260 STANDARD ERROR OF ESTIMATE: 20.616

VARIABLE COEFFICIENT STD ERROR STD COEF TOLERANCE T P(2 TAIL)

CONSTANT 90.648 2.350 0.000 . 38.575 0.000

HP -17.442 31:510 -0.275 0.300 =11.551 0.000

SES -6.966 1.193 -0.107 0.510 -5.838 0.000

BA 0.316 0.036 0.148 0.604 8.824 0.000

SF -0,029 0.040 -0.019 0.247 -0.715 0.474

BI 13.510 1.875 0.103 0.830 7.206 0.000

ANALYSIS OF VARIANCE

SOURCE SUM=-OF-SQUARES DF MEAN-SQUARE F=-RATIO P

REGRESSION 651963.089 5 130392.618 306.777 0.000

RESIDUAL 1851898.418 4357 425.040

AAAAAAAAAAAAAAAAAAAAAAAAAAAA44444AAAAAAA444444444444444
444444444444444444444444

Press ENTER <-' or RETURN

\


R

-—~

Fat Soil. PTH Acs AF#T

PEARSON CORRELATION MATRIX

PCOLL WACH BACH PBA PSF

PCOLL 1.000

WACH 0.759 1.000

BACH 0.593 0.621 1.000

PBA R 3/4 0.843 0.748 0.474 1.000

PSF 2 Ligh forest =0. -0.581 -0.417 -0.437 1.000

INC /ucgvre ~~ 0.825) 0.765 0.471 0.840 -0.764

POV % #ér: =0.509 -0.593 -0.369 -0.435 0.931

HOME ite ep 0. 867 0.712 0.511 0.929 -0.410

7. peal  . C=0.415> -0.422 -0.323 -0.256 0.738

INC POV HOME PB PM

INC 1.000

POV -0.727 1.000

HOME 0.813 -0.341 1.000

PB -0.290 0.407 -0.188 1.000

Press ENTER <=' or RETURN

>MODEL PCOLL=CONSTANT+PBA+INC

>EST

DEP VAR: PCOLL N: 22 MULTIPLE R: .880 SQUARED MULTIPLE R: .774
ADJUSTED SQUARED MULTIPLE R: .750 STANDARD ERROR OF ESTIMATE: 6.812

VARIABLE COEFFICIENT STD ERROR STD COEF TOLERANCE ~~ T  P(2 TAIL)

CONSTANT 5.419 11.685 0.000 : 0.464 0.648
PBA 0.661 0.269 0.511 0.277 2.463 0.024
INC 1.252 0.645 0.403 8.277 1.922 0.0€7

| ANALYSIS OF VARIANCE

| SOURCE  SUM-OF-SQUARES DF MEAN-SQUARE ~~ F-RATIO P

' REGRESSION 3013.905 2 1506.952 32.479 0.000
RESIDUAL 881.548 19 46.397

sAaAAAAAAAAAAAAAAAAAAAAAAAAAAAARAAAAAAAAA
AAAAAAAAAA4AAAAAA44444444444444440002

>

PE
RT
 A

D
T
S


F
r


V
a


A


CASE
CASE
CASE
CASE
CASE
CASE
CASE
CASE
CASE
CASE
CASE
CASE
CASE
CASE
CASE
CASE
CASE
CASE
CASE
CASE
CASE
CASE

W
o
o
»


W
N


HE


SD

4.000
11,000
23.000
40.000
43.000
47.000
48.000
52.000
54.000
56.000
64.000
77.000
94.000

119.000
128.000
132.000
139.000
146.000
155.000
159.000
164.000
165.000

Press ENTER <-' or RETURN

7 Pdi Spr Colleges

chef
74.700
46.900
60.200
56.800
39.500
39.700
46.700
63.600
71.100
54.200
29.600
43.700
61.500
48.400
77.400
54.500
52.200
51.700
75.500
70.000
52.600
32.500

LY Aor +/ HEF AN

PRECOLL1 PRECOLL2

76.437
54.953
61.100
57.657
40.093
41.273
50.367
61.480
69.136
64.085
30.854
46.634
50.273
46.634
79.643
59.628
51.805
46.782
66.367
52.301
52.571
42.406

——


76.088
50.186
62.463
58.812
39.707
41.865
51.164
62.204
68.820
64.901
28.299
48.412
50.820
48.020
79.120
59.031
52.591
48.318
65.721
52.842
51.192
42.548