North Carolina General Assembly State Representative Districts
Working File
January 1, 1977
Cite this item
-
Case Files, Thornburg v. Gingles Working Files - Williams. North Carolina General Assembly State Representative Districts, 1977. 001f96b2-da92-ee11-be37-6045bdeb8873. LDF Archives, Thurgood Marshall Institute. https://ldfrecollection.org/archives/archives-search/archives-item/2aa51bf6-edf7-445f-add4-a23b74224133/north-carolina-general-assembly-state-representative-districts. Accessed June 21, 2026.
Copied!
@9
District #
1
Counties
# of Reg.
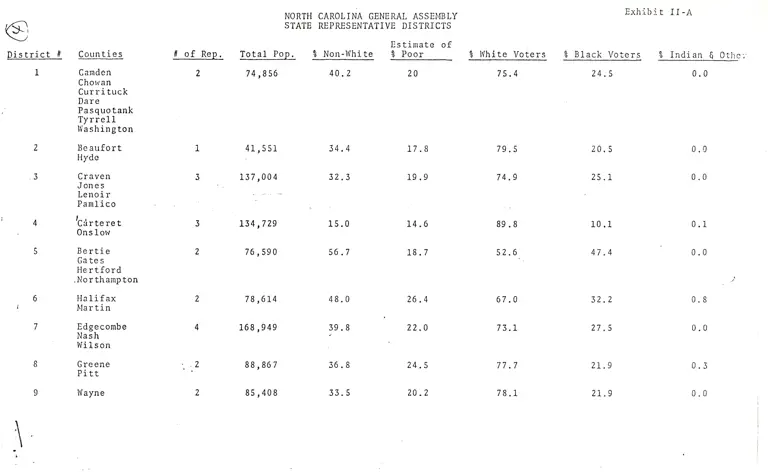
NORTH CAROLINA GENERAL ASSEMBLY
STATE REPRESENTATIVE DISTRICTS
Estimate of
0
Total Bop. % Non—White 6 Poor % White
Voters
% Black
Exhibit II-A
0
Voters 6 Indian 6 Other
Camden 2
Chowan
Currituck
Dare
Pasquotank
Tyrrell
Washington
Beaufort 1
Hyde
Craven 3
Jones
Lenoir
Pamlico
_%érteret 3
Onslow
Bertie 2
Gates
Hartford
.Northampton
Halifax 2
Martin
Edgecombe 4
Nash
Wilson
Greene -_.2
Pitt '
Wayne 2
74,856 40.2 20 75.
41,551 34.4 17.8 79.
137,004 32.3 19.9 74.
134,729 15.0 14.6 89.
76,590 56.7 18.7 52.
78,614 48.0 26.4 67.
168,949 39.8 ' 22.0 73.
88,867 36.8 24.5 77.
85,408 33.5 20.2 78.
4
24.
20.
25.
10.
47.
32.
27.
21.
21.
5 _0.0
4
1
Page 2 -- North Carolina General Assembly State Representative Districts
I Estimate of ‘
District # Counties # of Rep. Total Pop. % Non-White % Poor % White Voters Black Voters 8 Indian 6 Other
10 .Duplin 1 38,015 34.3 27.5 79.6 20.4 0.0
11 Brunswick 1 42,372 36.4 ‘ 23.5 74.6 25.4 0.0
Pender
12 New Hanover 2 82,996 22.9 14.1 84.1, 15.8 0.1
13 Caswell 3 126,232 44.2 20.5 65.8 33.8 0.4
Granville
Person
Vance
Warren
14 Franklin 2 88,557 27.5 24.8 82.8 17.1 0.1
Johnston _
15 Wake 6 228,453 22.6 10.1 85.9 14.1 0.0
16 Durham 3 132,681 32.9 11.9 76.1 23.7 0.2
17 Chatham 2 87,261 22.4 11.3 83.9 16.1 0.0
Orange t
18 Harnett 2 80,134 ' 24.4 18.0 85.1 14.8 0.1
Lee
19 Bladen 3 118,368 35.2 i 26.6 74.9 23.7 1.4
_Columbus
Sampson
20 Cumberland S 212,042 26.5 a 13.9 78.6 21.4 0.0
21 IHoke .3 128,207 52.9 24.6 V 50.3 25.4 24.3
_Robeson 9'
Scotland
22 Alamance 4 168,764 19.0 10.2 87.6 21.3 0.0
Rockingham
23 Guilford 7 288,590 22.5 8.9 84.4 15.6 0.0
Exhibit II-B
Page 3 -- North Carolina General AsSembly State Representative Districts
District # Counties
24 Randolph
25 Moore
26 Anson
Montgomery
27 Richmond
28 Allegheny
Ashe
Stokes
Surry
Watauga
29 Forsyth
30 ’Davidson
Davie
31 Rowan
32 Stanly
33 .Cabarrus
, Union
34 Caldwell
Wilkes
Yadkin
35 Alexander
Iredell
36 ’Mecklenburg
37 Catawba
38 Gaston
Lincoln
Estimate of
# of Rep. Total Pop. 4 Non-White % Poor % White Voters ' Black Voters Indian 8 Other
2-. 76,358 7.4 9.9 95.6 4.4 0.0
1 39,048 . 25.1 . 19.0 86.1 13.9 0.0
_1 42,755 36.8 22.0 79.0 21.0 0.0
1 39,889 29.7 ' 19.9 74.1 25.8 0.0
3 126,306 4.4 19.4 96.5 3.5 0.0
5 214,348 22.5 10.7 79.9 20.0 0.1
3 114,482 10.3 11.0 91.6 8.3 0.0
2 90,035 16.1 , 10.3 89.9 10.1 0.0
1 42,822 11.0 10.4 93.0 7.0 0.0
3 (129,343 17.4 . 10.4 89.3 10.7 0.0
3’ 130,822 5.7 15.9 95.5 4.5 0.0
' 2 91,663 '15.2 11.4 92.0 8.0 0.0
8 354,656 24.1 g 8.9 , ' 83.9 16.1 0.0
2 90,873 8.9 7.5 93.1 6.9 0.0
4 181,097 11.9 9.7 91.6 8.4 0.0
. . Exhibit II-D
Page 4 -- North Carolina General Assembly State Representative Districts
Estimate of
District # Counties 0 of Rep: 'Total Pop. % Non~White % Poor % White Voters % Black Voters 8 Indian 6 Other
39 Avery 2 86,466 5.3 15.4 96.5 3.5 0.0
'Burke ,
Mitchell
40 Cleveland 3 131,628 16.4 14.8 - 92.6 7.4 0.0
Polk
Rutherford
41 McDowell 1 43,277 4.2 19.6 96.9 3.1 0.0
Yancey
42 Henderson 1 42,804 4.7 21.0 97.1 2.9 0.0
43 Buncombe 4 - 164,769 8.7 13.4 93.7 6.3 0.0
Transylvania
LN
H
44 Haywood 2 87,167 ' 5.1 ’ 21.5 95.7 1.2
Uackson
Madison
Swain
45 Cherokee 1 43,860 2.8 26.3 98.6'- 0.9 0.5
Clay 4 .
Graham
Macon
”—1
,1 'Exhibit II—E
North Carolina General Assembly
State Representative Districts
1970 1977 Est. Present Estimated
Total Pop. Variance From Variance From
District Population Addition 1 Person, 1 Vote 1 Person, 1 Vote
1 74,856 10,273 -11.6. - .48
2 ,. 41,551 3,623 - 1.98 - .78
3 ‘137,004 10,148 + 7.88 +6.78
4 134,729 17,324 + 6 8 +10.38
5 76,590 444 - 9. 8 -16.18
6 78,614 1,678 - 7. 8 -12.68
7 168,949 9,797 - 8 - .88
8 88,867 5,960 + 4. 8 + 3.28
9 85,408 5,429 + .88 + 1.28
10 38,015 2,029 -10. 8 -12.98
11 42,372 11,914 + 1. 8 +18.18
12 82,996 13,923 - 2. 8 +5.48
13 126,232 4,048 - . 8 -5.58
14 88,557 5,503 - + 4.68 +2.68
15 228,453 44,005 -10.18 -1.28
16 132,681 10,463 + 4. 8 +3.88
17 87,261 11,966 +.3. 8 +7.98
18 80,134 8,966 — 5. 8 -3.18
19 118,368 10,551 - 6. 8 -6.58
20 212,042 18,875 + .18 + .48
21 128,207 13,923 + . 8 +3.08
22 168,764 6,045 — . 8 ~5.08
23 288,590 15,643 - 2. 8 -5.58
24 76,358 6,953 - 8. 8 -9.48
25 39,048 4,689 ~ 7. 8 -4.98
26 42,755 489 + .98 -6.08
27 39,889 1,928 - 5. 8 -9.18
28 126,306 15,954 - . 8 +3.28
29 214,348 13,315 + 1. 8 -1.08
30 114,482 9,096 -10. 8 -10.48
31 90,035 2,686 + 6. 8 +.88
32 42,822 2,027 + 1.18 -2.48
33 129,343 13,220 + 1. 8 +3.48
34 130,822 11,594 + 2. 8 +3.38
35 91,663 8,505 + 8. 8 +9.08
36 354,656 22,494 + 4. 8 +2.68
37. 90,873 8,849 + 7.38 +8.58
38 181,097 11,829 + 6. 8 +4.98
39 86,466 5,455 + 2. 8 0.08
40 131,628 10,204 + 3. 8 +2.98
41 43,277 4,863 + 2. 8 +4.78
42 42,804 7,811 + 1. 8 +10.08
43 164,769 8,814 — 2.88 -5.68
44 87,167 8,814 + 2. 8 +4.48
45 43,860 5,000 + 3.6° +6.38