Table of Population Data for Proposed Single Member District for N.C. State Senate in Winston-Salem/Guilford Counties
Working File
January 1, 1982
Cite this item
-
Case Files, Thornburg v. Gingles Working Files - Guinier. Table of Population Data for Proposed Single Member District for N.C. State Senate in Winston-Salem/Guilford Counties, 1982. 5a6f6daa-de92-ee11-be37-6045bdeb8873. LDF Archives, Thurgood Marshall Institute. https://ldfrecollection.org/archives/archives-search/archives-item/d3b9fbad-aab3-4d8a-9228-1a9199972d87/table-of-population-data-for-proposed-single-member-district-for-nc-state-senate-in-winston-salemguilford-counties. Accessed July 07, 2026.
Copied!
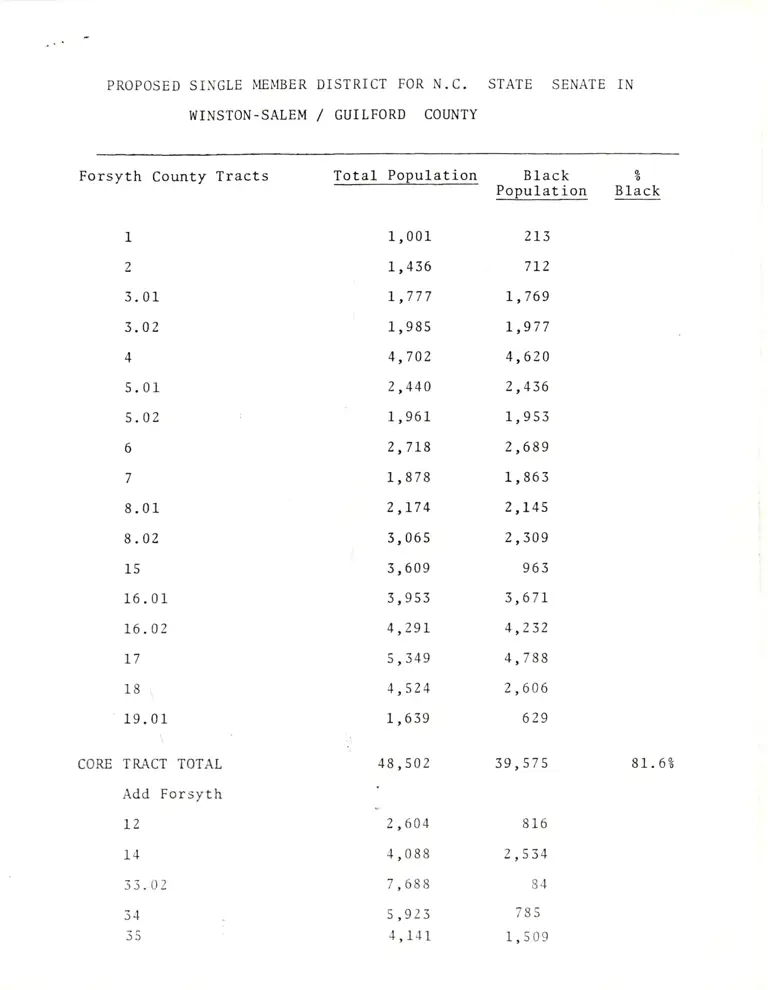
    PROPOSED SINGLE MEMBER DISTRICT FOR N.C.

WINSTON-SALEM / GUILFORD COUNTY

STATE SENATE IN


Forsyth County Tracts

CORE

1 1,001
2 1,436
3.01 1,777
3.02 1,985
4 4,702
5.01 2,440
5.02 1,961
6 2,718
7 1,878
8.01 2,174
8.02 3,065
15 3,609
16.01 3,953
16.02 4,291
17 5,349
18 4,524
19.01 1,639
TRACT TOTAL 48,502
Add Forsyth

12 ‘ 2,604
14 4,088
33.02 7,688
34 5,923
35 4,141

Total Population

Black
Population

0
6

Black


213

712
1,769
1,977
4,620
2,436
1,953
2,689
1,863
2,145
2,309

963

81.6%

Add Guilford
136.01
138
139
141
142
144.02
144.05
145.06
163
TOTAL

ADD IN FORSYTH 30

DISTRICT TOTAL

Possible Adjustment

Subtract 144.02

Add In 20.01

Alternate District

2,198
4,614
5,882

890
4,355
5,400
5,134
3,121
3,986

108,526

8,016

116,542

5,400

2,262

113,404

(-7.5)

329
3,962
5,207

619
1,687
62

453
2,072
311
60,005

2,392

62,397

62

636

62,971

55.3%

53.5%

55.5%