Table of Population Data for Proposed Single Member District for N.C. State Senate in Charlotte/Mecklenburg/Gastonia Counties
Working File
January 1, 1982
Cite this item
-
Case Files, Thornburg v. Gingles Working Files - Guinier. Table of Population Data for Proposed Single Member District for N.C. State Senate in Charlotte/Mecklenburg/Gastonia Counties, 1982. f5706daa-de92-ee11-be37-6045bdeb8873. LDF Archives, Thurgood Marshall Institute. https://ldfrecollection.org/archives/archives-search/archives-item/10c8db36-95fb-4ce7-af51-25bb513476cc/table-of-population-data-for-proposed-single-member-district-for-nc-state-senate-in-charlottemecklenburggastonia-counties. Accessed July 10, 2026.
Copied!
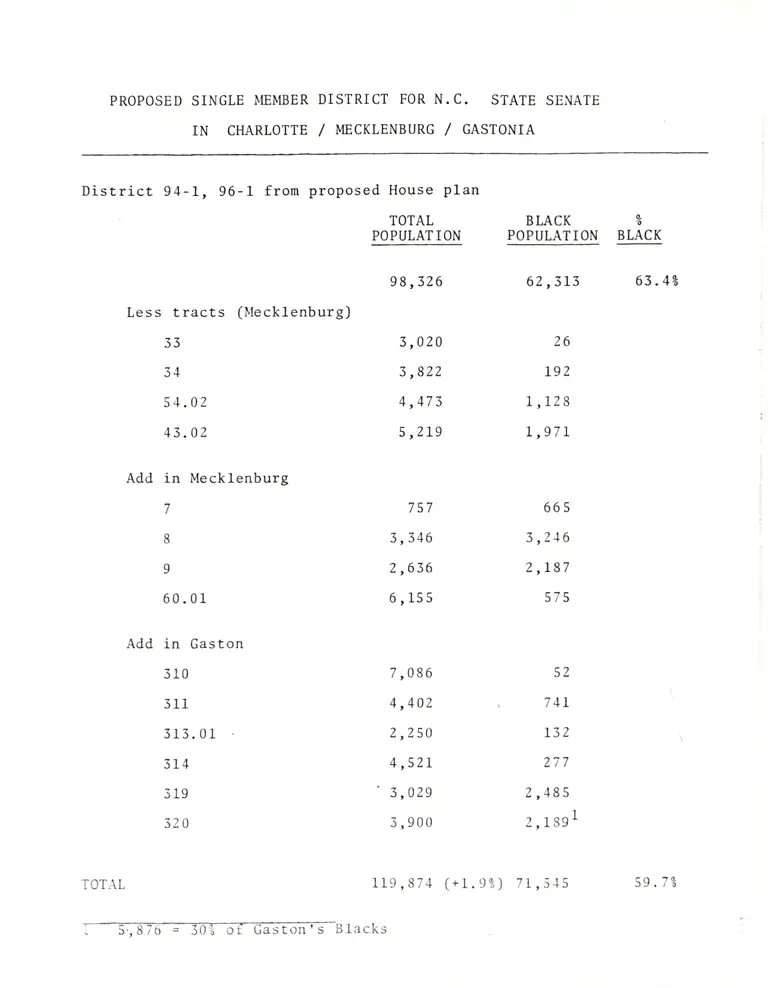
    PROPOSED SINGLE MEMBER DISTRICT FOR N.C. STATE SENATE

IN CHARLOTTE / MECKLENBURG / GASTONIA


District 94-1, 96-1 from proposed House plan


TOTAL BLACK %
POPULATION POPULATION BLACK
98,326 62,313 63.4%

Less tracts (Mecklenburg)

33 3,020 26

34 3,822 192

54.02 4,473 1,128

43.02 5,219 1,971
Add in Mecklenburg

7 757 665

8 3,346 3,246

9 2,636 2,187

60.01 6,155 575
Add in Gaston

310 7,086 52

311 4,402 741

313.01 2,250 132

314 4,521 277

319 ' 3,029 2,485

32 3,900 2,1991

TOTAL 119,874 (+1.99) 71,345 59.7%

5,876 = 300 of Gaston's Blacks