North Carolina General Assembly State Senate Districts
Working File
January 1, 1977
Cite this item
-
Case Files, Thornburg v. Gingles Working Files - Williams. North Carolina General Assembly State Senate Districts, 1977. e81e96b2-da92-ee11-be37-6045bdeb8873. LDF Archives, Thurgood Marshall Institute. https://ldfrecollection.org/archives/archives-search/archives-item/7a699df7-0ff9-41ac-a9e9-77d9f3af48dc/north-carolina-general-assembly-state-senate-districts. Accessed July 04, 2026.
Copied!
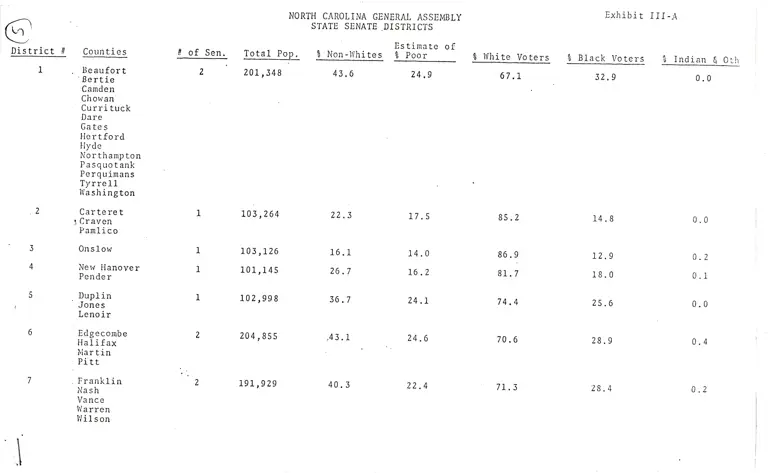
    NORTH CAROLINA GENERAL ASSEMBLY EXhibit III‘A

. -. ' STATE SENATE DISTRICTS
‘ Estimate of

District # Counties # of Sen. Total Pop. % Non—Whites % Poor % White Voters % Black Voters 8 Indian 8 Oth


1 , Beaufort 2 201,348 43.6 24.9 '67.1 32.9 0.0
'Bertie '
Camden
Chowan
Currituck
Dare
Gates
Hertford
Hyde
Northampton
Pasquotank
Perquimans
Tyrrell
Washington

.2 Carteret 1 103,264 22.3 17.5 85.2 14.8 0.0
Craven
Pamlico

3 Onslow 1 103,126 16.1 14.0 86.9 12.9 0.2

4 New Hanover 1 101,145 26.7 16.2 81.7 18.0 0.1
Pender

b ' Duplin 1 102,998 36.7 24.1 74.4 25.6 0.0
, Jones
Lenoir

6 Edgecombe 2 204,855 .43.1 24.6 70.6 28.9 0.4
Halifax ‘ . -.
Martin
-Pitt

7 .Franklin 2 191,929 40.3 22.4 ’ 71.3 28.4 0.2
Nash
Vance
Warren
Wilson

' LAKJTJ'UJ. L 1 11 *J)

Page 2 -- North Carolina General Assembly State Senate Districts

Estimate of
District # Counties # of Sen. Total Pop. ' % Non—Whites % Poor % White Voters % Black Voters % Indian 6 0th


8 Greene 1 100,375 35.5 21.5 76.7 23.2 0.0
Wayne

. 9 Johnston 1 1 106,691 27.6 25.9 ‘ 82.9 16.3 0.8
Sampson

10 Cumberland 2 212,042 . 26.5 13.8 , 78.6 21.4 , 0.0

11 Bladen 1 97,637 , 33.6 25.0 74.7 24.4 0.9
Brunswick
Columbus

12 Hoke 1 101,278 -56.9 25.6 45.6 25.0 29.4
Robeson

13 Durham 2 191,357 12.0 14.0 74.0 25.8 0.2
,Granville
’Ferson

l4 Harnett 3 ' 308,587 45.5 »' 12.0 85.7 14.3 0.0
Lee
Wake

15 .Alleghany 2 194,359 15.1 16.5 89.9 10.1 0.0
Ashe
Caswell
Rockingham
Stokes
Surry

l6 Chatham 2 202,667 .17.3 ' " 12.2 88.6 11.4 0.0
Moore '
.0range
.Randolph

age 3 -- North Carolina General Assembly State Senate Districts

'istrict 8

Counties


.’\

17

18
19
20

21

22

23

24

25

Anson

' Montgomery“

Richmond
Scotland
Stanly
Union

Alamance
Guilford
Forsyth

Davidson

Davie
Rowan

sCabarrus
Mecklenburg

Alexander
Catawba
Iredell
Yadkin

'Avery

Burke
Caldwell
Mitchell
'Watauga
Wilkes

.Cleveland
Gaston

i Lincoln
Rutherford

Estimate of

Exhibit III~C


# of Sen. Total Pop. % Non—Whites % Poor % White Voters % Black Voters % Indian 8 0th
2 207,109 25. 16.5 83.0 16.9 0.1
1 96,362 17. 8.7 89.5 10.5 0.0
3 288,590 22. 8.9 84.4 15.6 0.0
2 214,348 22. 10.7 79.9 20.0 0.1
2 204,517 12. 10.7 90.9 9.0 0.1
4 429,285 22. 8.9 84.8 15.2 0.0
2 207,135 11. 10.4 93.1 6.9 0.0
2 216,093 5. '15.9 96.4 3.8 0.0
. 3 300,990 13. 11.5 92.0 8.0 0.0

Page 4 -- North Carolina General Assembly State Senate Districts

Estimate of
District 8 Counties # of Sen._w Total Pop. % Non-Whites % Poor . .% White Voters % Black Voters % Indian 8 0th


26 Buncombe 2 204,336 7.4 16.3 94.7 5.3 0.0
Madison ' ‘
McDowell
Yancey

27 Cherokee 2 189,276 5.4 20.6 96.2 2.3 1.5
Clay _
Graham
Haywood
Henderson
Jackson
Macon
Pelk
Swain
Transylvania

g-
g


Exhibit III~E
North Carolina General Assembly
State Senate Districts
_.1970 1977 Est. Present Estimated
"Total Pop. Variance From Variance From
District Population Addition 1 Person, 1 Vote 1 Person, 1 Vote

1 201,348 14,720 -1% -2.1%

2 103,264 11,443 +1.68 +4.08
3 103,126 12,042 +1.58 +4.4%
4 101,145 17,275 —..05% +7.4%

5 102,998 6,016 +1.38 ~2.2%
6 204,855 10,182 + .8% -3.6%

7 191,929 14,975 -6.6% -7.3%

8 100,375 5,327 ~2.3% -4.2%
9 106,691 7,711 +5.0% +3.7%
10 212,042 18,875 +4.38 +4.7%
11 97,637 15,483 -4% +2.6%
12 101,278 11,089 - . % +1.9%
13 191,357 11,534 -6.9% -8.1%
14 308,587 52,971 +1.2% +9.3%
15 194,359 15,129 -4.4% —5.1%
16 202,667 23,608 - . % +2.6%
17 207,109 16,351 +1.9% +1.3%
18 96,362 2,254 -5.2% ~10.6%
19 288,590 15,643 —5.4% —8.1%
20 214,348“ 13,315 +5.4% +3.2%
21 204,517 11,782 + .6% -2%
22 429,285 26,641 +5.6% +3.3%
23 207,135 19,769 +1.98 +2.9%
24 216,093 19,720 +6.3% +6.9%
25 300,990 21,015 -1.3% -2.7%
26 204,336 12,661 + .5% -1.6%
27 189,276 22,959 -6.9% -3.8%