Statistics on Number of White/Non-White Voters by County
Working File
April 8, 1980
Cite this item
-
Case Files, Thornburg v. Gingles Working Files - Guinier. Statistics on Number of White/Non-White Voters by County, 1980. 8944a37b-df92-ee11-be37-6045bdeb8873. LDF Archives, Thurgood Marshall Institute. https://ldfrecollection.org/archives/archives-search/archives-item/8c1de740-b639-4aae-9eb4-e912f7009558/statistics-on-number-of-whitenon-white-voters-by-county. Accessed June 30, 2026.
Copied!
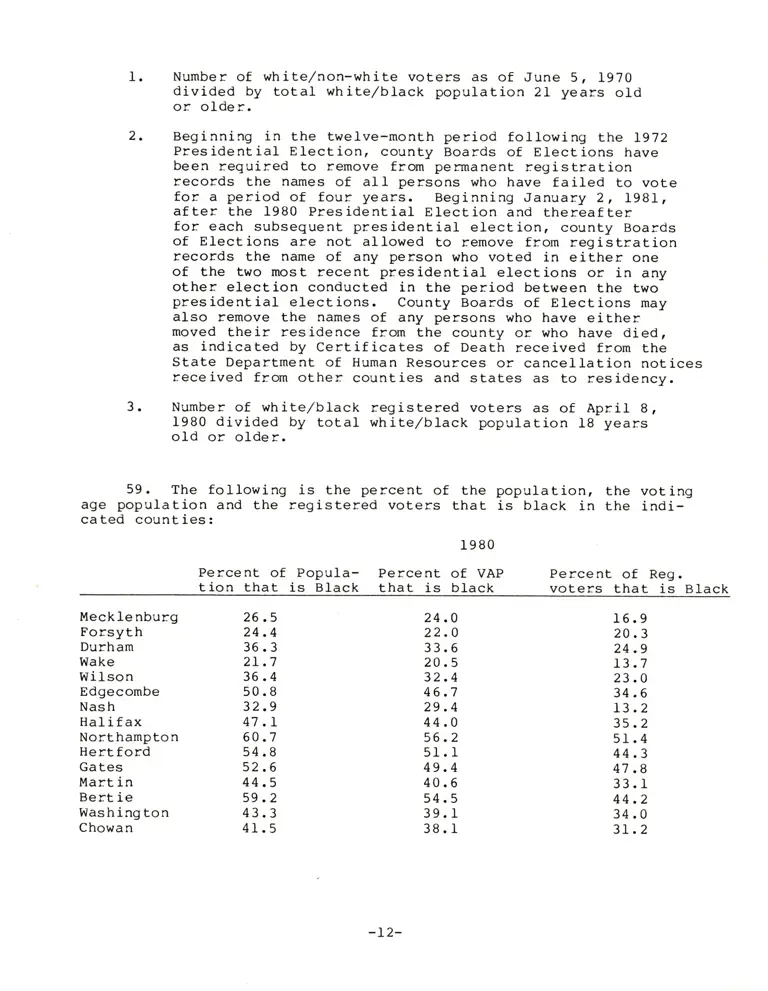
    59.

Number of white/non—white voters as of June 5, 1970
divided by total white/black population 21 years old
or older.

Beginning in the twelve—month period following the 1972
Presidential Election, county Boards of Elections have
been required to remove from permanent registration
records the names of all persons who have failed to vote
for a period of four years. Beginning January 2, 1981,
after the 1980 Presidential Election and thereafter

for each subsequent presidential election, county Boards
of Elections are not allowed to remove from registration
records the name of any person who voted in either one
of the two most recent presidential elections or in any
other election conducted in the period between the two
presidential elections. County Boards of Elections may
also remove the names of any persons who have either
moved their residence from the county or who have died,
as indicated by Certificates of Death received from the
State Department of Human Resources or cancellation notices
received from other counties and states as to residency.

Number of white/black registered voters as of April 8,

1980 divided by total white/black population 18 years
old or older.

The following is the percent of the population, the voting

age population and the registered voters that is black in the indi-
cated counties:


1980

Percent of Popula- Percent of VAP Percent of Reg.

tion that is Black that is black voters that is Black
Mecklenburg 26.5 24.0 16.9
Forsyth 24.4 22.0 20.3
Durham 36.3 33.6 24.9
Wake 21.7 20.5 13.7
Wilson 36.4 32.4 23.0
Edgecombe 50.8 46.7 34.6
Nash 32.9 29.4 13.2
Halifax 47.1 44.0 35.2
Northampton 60.7 56.2 51.4
Hertford 54.8 51.1 44.3
Gates 52.6 49.4 47.8
Martin 44.5 40.6 33.1
Bertie 59.2 54.5 44.2
Washington 43.3 39.1 34.0
Chowan 41.5 38.1 31.2

-12-