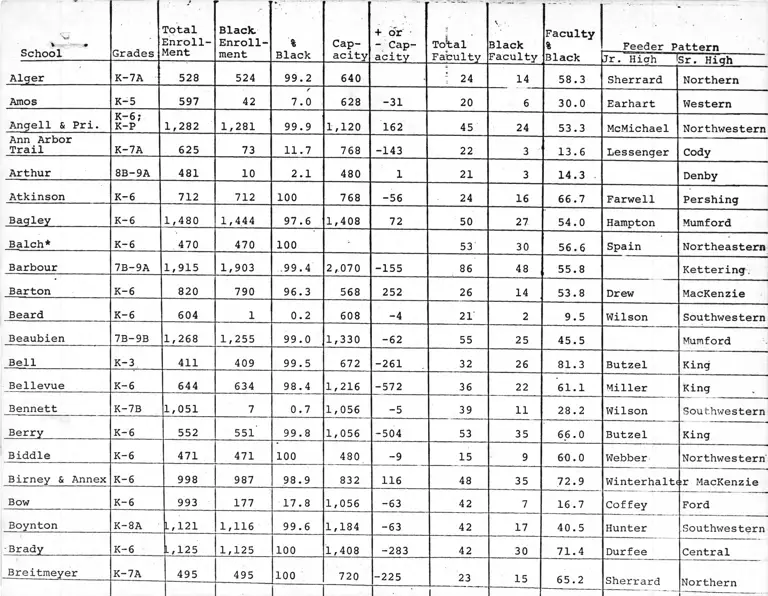
Analysis of Segregation Data by School
Working File
January 1, 1971
13 pages
Cite this item
-
Case Files, Milliken Working Files. Analysis of Segregation Data by School, 1971. 6761dc9f-54e9-ef11-a730-7c1e5247dfc0. LDF Archives, Thurgood Marshall Institute. https://ldfrecollection.org/archives/archives-search/archives-item/a768f3ff-37bf-44f0-b103-9671202667e2/analysis-of-segregation-data-by-school. Accessed July 06, 2026.
Copied!
‘•W
School Grades
Total
Enroll
Ment
* •
Black.
Enroll
ment
%
Black
Cap
acity
+ dr
- Cap
acity
ni
Total
Faculty
\ • .
Black
Faculty
Faculty
%
Black
Feeder Pattern
Jr. Hicrh ISr. Hiah
Alger K-7A 528 524 99.2 640 : 24 14 58.3 Sherrard Northern
Amos K-5 597 42 7.0 628 -31 20 6 30.0 Earhart Western
Angell & Pri. K-6;
K-P 1,282 1,281 99.9 1,120 162 45 24 53.3 McMichael Northwestern
Ann Arbor
Trail K-7A 625 73 11.7 768 -143 22 3 13.6 Lessenger Cody
Arthur 8B-9A 481 10 2.1 480 1 21 3 14.3 . Denby
Atkinson K-6 712 712 100 768 -56 24 16 66.7 Farwell Pershing
Bagley K-6 1,480 1,444 97.6 1,408 72 50 27 54.0 Hampton Mumford
Balch* K-6 470 470 100 ■- 53 30 56.6 Spain Northeastern
Barbour 7B-9A 1,915 1,903 .99.4 2,070 -155 86 48 55.8 Kettering.
Barton K-6 820 790 96.3 568 252 26 14 53.8 Drew MacKenzie
Beard K-6 604 1 0.2 608 -4 21 2 9.5 Wilson Southwestern
Beaubien 7B-9B 1,268 1,255 99.0 1,330 -62 55 25 45.5 Mumford
Bell K-3 411 409 99.5 672 -261 . 32 26 81.3 Butzel King
Bellevue K-6 644 634 98.4 1,216 -572 36 22 61.1 Miller King „
Bennett K-7B 1,051 7 0.7 1,056 -5 39 11 28.2 Wilson Southwestern
Berry K-6 552 551 99.8 1,056 -504 53 35 66.0 Butzel King
Biddle K-6 471 471 100 480 -9 15 9 60.0 Webber Northwestern'
Birney & Annex K-6 998 987 98.9 832 116 48 35 72.9 Winterhalte ;r MacKenzie
Bow K-6 993 177 17.8 1,056 -63 42 7 16.7 Coffey Ford
Boynton K-8A L, 121 1,116 99.6 1,184 -63 42 17 40.5 Hunter Southwestern
- Brady K-6 L, 125 1,125 100 1,408 -283 42 30 71.4 Durfee Central
Breitmeyer K-7A 495 495 100 720 -225 23 15 65.2 Sherrarj Northern
1 ■ 1
' ■ ' - ■
' ' ■* . »•. ' “ - ■ -£ - ---- * "
• *
School Grades
Total
Enroll
Ment
Black.
Enroll
ment
%
Black
Cap
acity
+ dr •
- Cap- Total
A •
Black
i
Faculty
% Feeder Pattern 1 :
acity Faculty Faculty Black Jr. Hiah (Sr. Hiah «
Brooks 7A-9A 603 9 1.5 580 * 23 . 27 3 11.1 Cody
-»* i•
s
Bunche* K-6 840 839 99.9 50 35 70.0 Miller King
Burbank
7B-9A
K-6; 801 20 2.5 940 -139 37 7 18.9 Denby
Burgess K-6 368 1 0.3 576 -208 17 1 5.9 Taft Ford
Burns K-6 1,451 868 59.8 1,312 139 58 20 34.5 . Cadillac Cooley
Burroughs 7B-8A 1,596 1,423 89.2 1,440 156 72 32 44.4 Kettering
Burt K-8A 1,012 0 0 992 34 7 20.6 Redford -
Burton* K-6 557 82 14.7 33 9 27.3 Jefferson Murray"
Butzel 7B-9B 1,412 1,383 97.9 1,784 -372 67 41 61.2
-Mtx.xgnTi_____ _
King
Cadillac 882 345 39.1 800 82 32 9 28.1 Cooley
Campau* K-3 989 971 98.2 14 10 71.4 Knudsen Northeastern
Campbell SAnnex K-6 989 971 98.2 66 39 59.1 Knudsen Northeastern
Carleton K-7A 967 174 18.0 1,024 -57 33/ 5 15.2 Arthur Denby
Carstens K-7 2,143 1,029 48.0 2,016 127 168 18 Finney
Carver K-7A 726 64 8.8 800 -74 26 6 23.1 Ruddiman Cody
Cary K-6 770 462 60.0 800 -30 30 16 53.3 McMillian Southwestern
Central 9B-12A 2,140 2,140 100 2,350 -210 93 53 55.9
Cerveny- Stratford K-9A 1,612 1,214 75.3 1,380 232 66 17 25.8 Cooley
Chadsey 10B-12/si, 654 907 54.8 2,006 -352 87 19 21.8
Chandler K-6 746 740 99.2 1,248 -502 33 19 57.6 Barbour Kettering.
- Chaney K-6 534 508 95.1 864 -330 31 20 64.5 Pelham Murray/Wright
Chrysler* K-6 196 82 41.8 10 2 20.0 Miller King.... ■ 1 ~ ’ H ----------------- -----
School Grades
'" » f "
Total
Enroll
Ment
Black.
Enroll
ment
• - -
%
Black
>.--- - -
Cap
acity
+ ori _•- Cap
acity
— - — - ■ -- -
Total
Faculty
y. *.
Black
Faculty
i
Faculty
%
Black
~.n „ . . •' . '• '«*..£ ... . .
Feeder Pattern
Jr. Hiah Isr. Hiah
Clark K-8A 1,288 0 0 960 1 328 46 9 19.6 Finney
Cleveland 7B-9A 1,203 861 71.6 1,210 -7 58 29 50.0 Osborn
Clinton K-6 1,609 1,560 97.0 1,440 169 57 37 64.9 Post Cooley
Clippert K-7A 391 25 6.4 720 -329 20 5 25.0 Munger Chadsey
Cody
10B-
12A 3,516 141 4.0 3,250 266 145 17 13.1 • . ' i• \ ■■
Coffey
K;7B-9B 669 194 29.0 738 -69 31 9 29.0 Ford
Columbian K-6 625 625 100 896 -271 28 18 64.3 Condon Western
Columbian Pri. K-Pl 202 202 100 288 -86 8 4 50.0 Condon Western
Columbus K-6;7B-9B 1,182 11 0.9 1,009 173 42 10 , 23.8 Denby
Condon 7B-9B 1,108 1,017 91.8 1,010 98 46 29 63.0 Western
Cooke K-8A 996 0 0 960 36 3 5 6 17.1 Redford
Cooley 10B-12A 2,876 2,192 76.2 2,460 416 121 34 28.1 ■ _■-■■■ • •• x
Coolidge K-7A 1,183 25 2.1 1,184 -1 40 5 12.5 Brooks Cody
Cooper K-6 1,678 1,210 72.1 1,728 -50 61 25 65.8
Courtis K-6 1,489 1,461 98.1 1,376 113 49 22 44.9 Noble MacKenzie
Courville K-6 1,585 1,559 98.4 1,696 -111 59 31 52.5 Nolan Pershing
Couzens* K-6 680 663 97.5 43 29 67 .4 Jefferson Murray/ .
Wright
Craft K-6 493 428 86.8 576 -83 20 16 80.0 Condon Western
Crary K-8A 921 190 20.6 960 -39 33 10 30.3 d Cooley
Crosman K-6 1,097 1,091 99.5 1,344 -247 41 28 68.3 Hutchins Northern k
Custer K-6 1,510 1,507 — 9.9.8__ 56 32 57.1 Lonafellow Central
Davison K-6 1,373 1,330 96.9 1,472 56 34 60.7 Cleveland Pershing
~1 ~ ”
•
• * t ■ ' ■
•
School Grades
Total
Enroll
Ment
Black.
Enroll
ment
l
%
Black
V .
V:- .
Cap
acity
+ or •
- Cap
acity
Total
Faculty
V *.
Black
Faculty
Faculty
%
Black
^ ■. •
Feeder Pattern - *
Jr. Hicrh fSr. Hioh
Denby 9B-12A 2,949 73 2.5 2,480 469 • 121 21 17.4
*
Dixon K-7A 816 12 1.5 928 -112 38 12 31.6 Lessenger Cody
Dossin K-7A 576 29 5.0 576 0 30 7 23.3 Cadillac Cooley
Doty K-6 730 716 98.1 912 -182 28 17 60.7 Hutchins Northern
Dow K-6 628 8 1.3 736 -108 28 2 7.1 . Taft Ford
Drew 7B-9A 1,587 1,508 95.0 1,810 -223 70 35 50.0 MacKenzie
Duffield* K-6 787 738 93.8 57 45 78.9 Miller King
Durfee 7B-9A 1,496 1,496 100 1,810 -314 69 52 75.4 Central
Dwyer K-7A 745 742 99.6 1,088 36 27 75.0 Sherrard Northern
Earhart 7B-9B 1,111 95 8.6 990 121 52 13 25.0 Western
Edison K-8B 659 18 2.7 640 19 ~ 26 7 26.9 Cadillac Cooley
Edmonson* K-6 1,278 1,016 795 77 52 67.5 Jefferson Murray/ .Wr i rrh +■
-Edmonson Annev t ' 26Q ___219 — 81.4 - ’ 15 8 53.3 Jefferson Murray/Wriqht
-Ellis__________ K-7B __756 541 71.6 840 -84 31 14 45.2 Condon Wpqfprn -
-Emerson_______
K-6;
7B-9A 1,372 50 3.6 1,420 ’ -48 54 10 18.5 Redford
Estabrook K-4 309 306 99.0 656 -347 18 13 72.2 McMichael Northwestern
Everett K-7A 302 1 0.3 352 -50 11 2 18.2 Brooks Cody
Fairbanks K-6 479 450 93.9 608 -129 18 10 55.6 Hutchins Northern
Farwell 7B-8A 566 384 67.8 1,352 -786 25 8 32.0 Pershing .
Ferry & Annex* K-6 L, 154 768 66.6 57 32 56.1 Greusel Northeastern
Field K-4;,. 6 __6&0__ __ 613__ -9.0.1 1 ,760 -am 6Q 9 ICi nrr
Field Annex 3-5 279 252 90.3 w/Fielc 28 17 60.7 Butzel King
1 1 1
. 15 ■*
School
'
Grades
Total
Enroll
Ment
Black.
Enroll
ment
%
Black
Cap
acity
+ or
- Cap
acity
Total
Faculty
V
Black
Faculty
Faculty
%
Black
- ’ • • 'TV - r
Feeder Pattern
Jr. Hicrh ISr. Hiah !
Finney
9B-
12A 2,658 973 36.6 2,160 498 112 17 15.2
A
m
Fisher K-2 197 197
<
100 232 -35 9 1 11.1 Hunter Rmif'hwpR't’PTB
Fitzgerald K-6 1,883 1,854 98.5 2,112 -258 92 49 53.3 Post Cooley
Fleming K-7A 653 1 0.2 672 -19 23 2 8.7 VonSteuben Osborn
Foch 7B-8A 1,640 1,564 95.4 1,650 -10 67 35 52.2 Southwestern
Ford, George K-6;7B-9A 731 259 35.4 840 -109 32 5 15.6 MacKenzie
Ford, Henry 10B-
12A 3,082 617 20.0 2.850 532 125 19 15.2
Foster K-6 586 586 100 37 27 73.0 i n
Fox K-PU-2 137 0 0 160 -23 4 2 50.0 Cof f <=>y Fr>Td ■
Franklin K-8A 1,061 187 17.6 1,568 54 14 25.9 Pp>1 ham Murray/
Gardner K-7A 611 1 0.2 544 67 22 5 22.7 R u d d i m a n Pnflw
George* K-6 271 271 100 20 13 65.0 Spain N o r f h p a <»T“ir
Glazer K-6 753 753 100 832 -79 58 19 67.9 TiO nrrf p>1 1 nw Pp*n +- r a 1
Goldberg K-6 896 871 97.2 1,376 -480 34 25 73.5 H u h r - h i n<3
Gompers K-6 461 0 0 480 -19 18 2 11.1 Harding Rp>d f rv rd
Goodale K-9A 1,186 8 0.7 1,060 126 38 . 5 13.2 n^phy
Grant K-8A 787 206 26.2 930 -143 29 5 17.2 O s h n r n
Grayling K-6 632— 29 4.6 662 -30 30 9 30.0 Nolan Pprshi nrr
GreenfieldPark K-8A .L, 548 592 38.2 1,600 -52 57 19 33.3 Nolan Pprsh i n nGreenfieldUnion K-6 . 614 56 9.1 480 134 22 6 27.3 Nolan Pershing *•
Greusel* 7B-8A 698 __514 73.6 3 4 15 44.1 Northeastern
Guest K-8A ̂/ 529 1,429 93.5 1,488 41 53 28 52.8 Cerveny-
1
CooleyI
\ l
- - ■ ■
School Grades
Total
Enroll
Ment
Black.
Enroll
ment
%
Black
Cap
acity
. / , -'i
+ or •
- Cap-
. . ..
Total
\ •
Black
Faculty
% Feeder Pattern - '
acity Faculty Faculty Black Jr. Hiah Sr. High
Guyton K-7A 1,083 331 30.6 1,056 27 . 40 4 10.0
■ ■ ' . *
Finney
Hally K-7A 848 843 99.4 992 -144 31 15 48.4 Cooley
Hamilton K-7A 990 701 70.8 928 62 35 6 17.1 Jackson Finney
Hampton K-8A 1,775 1,333 75.1 1,800 25 76 30 39.5 Mumford
Hanneman K-7A 676 332 49.1 680 -4 26 12 46.2 Munger Chadsey
Hanstein K-6 240 29 12.1 352 -112 13 4 30.8 Finney
Harding K-9A 1,592 152 9.5 1,510 82 62 10 16.1 Redford
Harms K-6 687 2 0.3 704 -17 24 3 12.5 Wilson Southwestern
Harris* K-6 392 389 99.2 26 10 , 38.5 Miller King
Healy K-6 298 0 0 416 -118 13 2 15.4 Murphy Redford
Herman K-6 1,505 881 585 1,824 -319 56 19 33.9 Ruddiman Cody
Higginbotham K-6 606 605 99.8 960 -354 28 16 Beaubien Mumford
Higgins K-6 808 5 0.6 856 -48 28 6 21.4 Wilson Southwestern
Hillger K-6 624 621 99.5 672 -48 30 19 63.3 Barbour Kettering .
Holcomb K-7A 779 8 10.3 864 27 2 7.4 Emerson Redford
Holmes, A. L., & Annex K-6 1,908 1,779 93.2 1,904 4 75 33 44.0 Bur m u ahc:
Holmes, 0. W. K-7A 652 139 21.3 928 -276 27 9 33.3 Munqer
u L-v— _i_ xxxh
Charispy
Hosmer K-7A L, 064 193 18.1 1,056 8 32 5 15.6 Jackson Finney
Houghten K-6 919 10 10.9 1,008 -89 ■ 35 5 14.3 Murphy Rp>r) fnrH
Howe K-6 .,.075 1,067 99.3 1,152 -77 39 21 Foch
.Hubert K-6 854 17 2.0 944 -90 42 11 26.2 Murphy
kJ C* LA L11 v—- d 0 L L. JL XI
Redford
Hunter K-9B 639 245 38.3 900 -261 33 20 60.6 Southwestern
~I " ’
.
' ' - . ' ■ . •
School Grades
# ■- . 0
Total
Enroll
Ment
Black.
Enroll
ment
%
Black
Cap
acity
+ or
- Cap
acity
Toilal
Faculty
V .
Black
Faculty
i
Faculty
%
Black
' .’ v ■ ‘
Feeder Pattern
Jr. Hiah ISr. Hi ah
Hutchins 7B-8A 1,149 1,139 99.1 1,980 -831 . \ 59 47 79.7 Northern
Hutchinson K-6 1,145 1,114 97.3 1,120 25 42 13 31.0 Joy Finney
Ilene Pri. K-3 333. 330 99.1 Post Cooley
Ives K-7A 646 84 13.0 536 110 20 6 • 30.0 Finney
Jackson 8B-9A 1,568 679 43.3 1,450 118 63 18 28.6 . Finney
Jamieson K-6 1,343 1,342 99.9 1,408 -65 47 31 66.0 McMichael Northwestern
Jefferson* 7B-9A 881 764 86.7 50 26 52.0 Murray/
-Jsf-fries------- -K=£--- :__613__ __ 602. 98.2 __768 -155 22 11 50.0 Hunter Southwestern
Jof fe K-3 290 286 98.6 320 -30 13 7 53.8 Durfee ' Central
Jones & Annex K; 3-6 1,302 1,293 99.3 1,568 59 34 57.6 Barbour Kettering
____________ 7B-9A 1,708 1,687 98.8 1,570 138 73 29 39.7 Finney
Joyce K-6 774 769 99.4 1,056 -282 38 18 47.4 Barbour Kettering
Keating K-7A 1,687 1,581 93.7 1,776 -89 63 36 Foch Southeastern
Keidan K-6 1,394 1,392 99.9 1,440 -46 50 32 64.0 Winterhalt« :r MacKenzip
Kennedy K-6 525 407 77.5 704 26 9 34.6 Pelham Murray/
Wright
Totterincr 9B-12A 3,472 3,373 97.1 2,730 742 140 80 57.1 • . A .
King, J. . R. K-8B 986 905 91.8 736 250 36 14 38.9 Cooley
King, M. L- 9A-12A 1,879 1,876 99.8 1,910 -31 80 49 61.3
Knudsen* 7B-9A 877 867 98.9 45 34 75.6 Northeastern
Kosciusko K-7A 615 0 0 608 7 23 3 13.0 Lessenger Cody .
■Krolik K-PU 466 465 99.8 480 -14 16 2 12.5 Joy Finney
Larned K-6 231 1 0.4 288 -57 8 1 12.5 Taft Ford— j ---------
•
School Grades
Total
Snroll-
Ment
Black.
Enroll
ment
%
Black
Cap
acity
- >
- <
+ dr '
- Cap
acity
Total
Faculty
V • .
Black
Faculty
Faculty
%
Black
------- - ------------------------■— ; r —' - • j
.* • • - • * '
Feeder Pattern . •*’
Jr. Hiah ISr. Hioh
Law K-7A 397 59 14.9 384 13 ■ :: 22 8 36.4 Grant
•
Osborn
Leslie K-7A 535 40 7.5 640 -105 24 2 16.7 Ruddiman Cody
Lessenger 8B-9A 1,040 86 8.3 1,070 -30 48 11 22.9 Cody
Lillibridge K-6 1,551 1,449 93.4 1,696 -145 53 14 - Foch Southeastern
Lincoln* K-6 437 437 100 30 21 70.0 . Spain Northeastern
Lingemann K-6 967 582 ‘ 60.1 895 71 31 10 Foch Southeastern
Lodge K-6 341 24 7.0 416 -75 Murphy Redford
Logan K-7A 588 16 2.7 816 30 7 23.3 Munger Chadsey
Longfellow 7B-8A 1,027 1,023 99.6 1,638 -611 48 30 62.5 Central
Lynch K-6 600 40 6.7 608 -8 22 7 31.8 Burroughs Kettering
MacCulloch K-7A 1,482 1,471 99.3 1,536 -54 52 32 61.5 Durfee Central
MacDowell K-6 910 894 98.2 976 -66 33 21 63.6 Beaubien Mumford .
Mack Pri. 173 171 98.8 V 6 2 33.3 Joy Finney
Mackenzie 9A-12A 3,250 3,145 96.8 2,820 430 142 49 34.5
>■
Macomb K-6 537 15 2.8 . 544 -7 21 4 19.0 Goodale Denby
Mann K-7A 499 17 3.4 704 * 23 2 8.7 Lessenger Cody
Marcy K-6 594 584 98.3 832 -238 32 24 75.0 Barbour Kettering -
Mark Twain K-6 684 682 99.7 992 -308 29 12 Hunter Southwestern
Marquette K-8A 688 4 50.6 928 -240 • 27 4 14.8 Finney
-Marsh__________ K-6 183 0 0 352 -169 9 1 11.1 Brooks Cody *
-Marshall K-7A 1,392 905 65.0 46 1 6 34 . a
Marxhausen K-6 1,108 1,074 96.9 928 180 33 17 51.5 Joy
-----— -----------
Pi
. ‘ ‘ .. 1
•• ' ’ • ' . . • • . . • ■
School Grades
Total
Enroll
Ment
Black,
Enroll
ment
!
%
Black
Cap
acity
+ or ■
- Cap
acity
Total
Faculty
V • .
Blac^c
Faculty
Faculty
%
Black
r‘ V - '
• ’
Feeder Pattern
Jr. High ISr. High
Mason K-7A 837 441 52.7 768 69 42 is 42.9 Farwell Pershing
Maybee K-7A 454 452
✓ ■
99.6 832 -378 25 18 72.0 Sherrard Northern
Maybury K-6 629 18 2.9 608 21 21 5 23.8 Earhart Western
McColl K-7A 394 2 0.5 544 -150 14 1 -! 7.1 Lessenger Cody
McFarlane K-7 935 767 82.0 1,308 -373 32 14 43.8 Drew MacKenzie
McGraw K-6 659 624 94.7 8 00 -141 23 10 '43.5 Webber Northwestern
McGregor K-6 438 77 17.6 480 -42 14 2 14.3 .Burbank Danby
McKenny K-6 840 48 5.7 1,152 -312 34 5 14.7 Taft Ford -
McKerrow K-6 1,078 1,063 98.6 1,248 -170 39 23 59.0 Tappan • MacKenzie
McKinstry K-6 596 24 4.0 640 -44 22 2 9.1 Earhart Western
McLean K-7 A 214 0 0 352 -138 9 3 33.3 Lessenger Cody
McMichael 7B-8A 980 978 99.8 1,540 -560 45 35 77.8 Northwestern
McMillan K;
73-8A- 426 205 48.1 640 -214 22 10 45.5 Southwestern
Mettetal 7B-9A 653 236 36.1 700 -47 32 7 21.9 Ford .
Miller* 7B-9A 1,055 1,037 98.3 . 51 29 56.9 King
Monica Pri. K-3 377 371 98.4 Post Cooley
Monnier K-6 1,405 1,242 88.4 1,344 61 47 18 38.3 Noble MacKenzie
Monteith K-6 762 682 89.5 1,040 -278 35 19 54.3 Butzel King
Moore K-7A 533 533 100 992 -459 26 18 69.2 Sherrard Northern .
Morley K-6 685 114 16.7 896 211 3 0 11 36.7 McMillan Southwesterr
'Mumford 9B-12A 3,059 3,001 98.1 2,600 459 130 41 31.5
Munaer 8B-9A 980 455 46.4 864 126 45 14 31.1 Chadsey
1 1
School Grades
Total
Enroll
Ment
Black.
Enroll
ment
%
Black
1 ■ ~ r*' • ■
Cap
acity
— c- '* -,v.
+ or
- Cap
acity
Total
Faculty
\ .
Black
Faculty
i
Faculty
%
Black
■ • V : ' •
Feeder Pattern •
Jr. Hicrh Hr. Hi nh
Murphy 7B-9A 1,259 123 9.8 1,280 -21 55 12 21.8 Redford
Murray-Wright* 10B-
12A 2,072 1,974
/
95.3 102 46 45.1
Myrtle K-6 500 291 58.2 632 -132 26 9 34.6 Pelham
Neinas K-7B 702 31 4.4 768 -66 28 7 25.0 Earhart WfaRtja'rn
Newberry K-6 946 689 72.8 992 -46 34 18 52.9 Condon Western
Newton K-7B 849 185 21.8 880 -31 32 12 37.5 Winship Cooley
Nichols K-6 799 783 98.0 1,048 -249 31 12 38.7 Butzel
----- —■*-
King
Noble K-9B 1,903 1,837 96.5 1,720 183 80 47 58.8 MacKenzie
Nolan 7B-9A 1,392 949 68.2 1,370 22 59 19 32.2 Pershing
Northeastern* 9B-12A 1,437 1,339 93.2 72 31 . 43.1
Northern 9B-12A 1,767 1,748 98.9 2,230 -463 73 51 69.9
Northwestern 9B-12A 2,981 2,977 99.9 2,840 141 123 78 63.4 . . ...' . L . : . . - - - .. - 3
Norvell* K-6 296 296 100 v 21 12 57.1 Knudsen Northeaster®
Osborn 9B-12A 3,071 431 14.0 2,630 441 131 20 15.3
Owen K-6 496 351 70.7 832 . 14 6 42.9 Pelham Murray/Wriahr
Palmer K-7A 423 423 100 768 -345 22 10 45.5 Sherrard Northern
Parke & Annex* K-6 807 467 57.9 23 12 52.2 Greusel Northeastern
Parker K-6 1,597 1,268 79.4 1,600 -3 56 22 39.3 Drew MacKenzie
Parkman K-8A 647 83 12.8 768 -121 • 24 4 16.7 Brooks Cody
Pasteur K-6 L, 000 921 92.1 1,120 -120 35 17 48.6 Hampton Mumford *
Pattengill K-6 L, 412 1,404 99.4 1,600 -188 52 34 65.4 Webber Northwester®
Peck K-6 985 980 99.5 1,248 -265 33 26 78.8 Durfee Central
l
■ - . : ' .
. ■ ■
■ . ■ • ' ■ ■
School Grades
Total
Enroll
Ment
r -
Black.
Enroll
ment
%
Black
Cap
acity
+ or
- Cap
acity
Total
Faculty
V • .
Black
Faculty
Faculty
%
Black
1 . • ■ .
'■ ■ * - y - r ■
Feeder Pattern
Jr. Hiah ISr. Hiah
Pelham 7B-9A 721 586 81.3 930 -209 34 18 52.9 Murray/Wriqht'
Pershinq 9B-12A 3,244 2,069 63.8 2,600 644 136 31 22.8
Pierce K-6 483 300 62.1 576 -93 20 3 15.0 Grant Osborn
Pinqree K-6 706 706 100 848 -142 38 25 ' 65.8 Barbour Lettering
Pitcher K-6 657 42 6.4 896 -239 Mettetal Ford
Post 7B-9A 1,673 1,662 99.3 1,508 165 71 49 69.0 Cooley
Potter K-3 153 130 85.0 244 -73 8 5 62.5 Condon Western
Preston 255 82 32.2 - 12 3 25.0 Earhart Western
Priest K-7A 1,057 178 16.8 992 -65 51 12 23.5 Munger Chadsey -•
Pulaski K-6 709 45 6.3 1,168 -459 30 6 20.0 VonSteuben Osborn
Redford 9B-12A 3/781 107 2.8 2,710 1071 152 26 17.1
Reeves K-4 89 2 2.2 160 -71 4 1 25.0 Taft Ford
■ ■. •
Richard H U * 699 23 3.3 920 -221 32 6 18.8 Osborn
Robinson K-6 755 20 2.6 912 -157 28 6 26.7 Columbus Denby
Roosevelt K-7A 1,578 1,573 99.7 1,760 -182 . 55 35 63.6 Durfee Central
Rose K-6 645 630' 97.7 576 69 22 12 54.5 Burrough Kettering
.
Ruddiman 7B-9A L, 190 231 19.4 1,200 10 54 10 18.5 Cody
Ruthruff K-5 695 689 99.1 736 -41 26 21 80.8 Tappan MacKenzie
St. Clair K-6 911 884 97.0 1,568 -140 33 12 36.4 Joy Finney
St. Clair Annes K-6 517 513 99.2 w/St. Clair 19 10 52.6 Joy Finney %
-Sampson K-6 766 765 99.9 1,200 -434 29 19 65.5 Webber Northwestern
- '
Sanders K-6 669 668 99.9 1,024 -355 24 18 75.0 Hutchins Northern
. ■ . • • . • • . . . . 1 . —
. . . - '
. . .
- - - - - '
t
%
Black
* ' V . . . . . . . . . . .
■ - ■ . . • • •
V Hi
- . , j
School \ Grades
Total
Snroll-
Ment
Black.
Enroll- Cap-
+ or
Cap- Total
v , • .
Black
Faculty
% Feeder Pattern - "ment acity acity Faculty Faculty Black Jr. Hiah Sr. HighSchulze & ■* Annex K-6 1,268 1,255 99.0 33 15 45.5 Beaubien ■. -. * ■Mumford
Scripps & Annex K-6 1,231 1,213
/
985 1,416 60 26 Foch Southeastern
Sherrard 8B-9A 636 636 100 750 -114 33 15 45.5 Northern
. '
Sherrill K-7A 1,357 1,344 99.0 1,440 -83 48 24 50.0 Drew MacKenzie
Sill K-5 511 489 95.7 544 -33 18 9 50.0 . Condon Western
Southeastern 9B-12A 2,710 2,630 97.0 2,310 400 100 39 39.0
Southwestern 9B-12A 1,767 1,312 74.3 1,930 -163 77 21 27.3 ■ ' •
.
Spain* 7B-9A 757 757 100 - - 43 28 65.1
—
Northeastern
•
Stark K-7A 853 836 98.0 912 -59 29 14 Foch Southeastern
•
Stellwagen K-8A 827 0 0 736 91 24 0 0 Finney
Stephens K-6 973 962 98.9 1,088 -115 41 31 75.6 Burroughs Kettering
Stevenson K-3 317 299 94.3 192 125 11 5 45.5 Tappan MacKenzie
Stewart K-6 766 757 98.8 800 -34 27 13 Longfellow Central
Taft 7B-9A 987 7 0.7 970 17
* .
Ford *
_Tappan_______ 6-9A 1,469 1,466 99.8 1,460 9 63 44 69.8 MacKenzie
Tendler K-PU 376 331 88.0 288 88 13 3 Foch Southeastern
Thirkell K-6 902 902 100 1,344 -442 32 27 84.4 Hutchins Northwestern
Thomas K-6 541 498 92.1 568 -27 21 10 47.6 Greusel Northeastern
Trix K-6 619 146 23.6 688 -69 22 4 18.2 Richard Osborn •
Trombly K-3 300 271 90.3 • 14 9 Burroughs Kettering*
.
Turner, E. M.__ K-3 __3.45.. _ _ _ _ _ _ _345_ _ _ _ _ _ _ _ ■IQQ_ _ _ _ _ _ _ _ _ _ _ _ __384 12 9 75.0 Longfellow Central
Vandenberg K-6 418 391 93.5 416 2 18 10 55.6 Beaubien Ford
n - -
School Grades
_ _ - - f— -■«
Total
Enroll
Ment
Black.
Enroll
ment
%
Black
1 --~---
Cap
acity
+ or -
- Cap
acity
Total
Faculty
Black
Faculty
Faculty
%
Black *
- •» ■ ._ \,:X-
Feeder Pattern
Jr. Hiah ISr. Hiah
Van Zile K-6 794 409 51.5 w/Far well 27 10
■ _ *
37.0 1 Farwell Pprsh i nrr
Vernor K-6 994 963 96.9 928 31 16 51.6 Beaubian Ford
Vetal K-9A L, 173 2 0.2 1,056 39 6 15.4 Ppdtfvrd
Von Steuben 7B-9A 956 3 0.3 970 43 5 11.6 Osborn
Wayne K-7A 806 13 1.6 832 -26 30 5 16.7 Arthur Denby
Weatherby K-7A 330 0 0 416 -86 14 2 14.3 Lessenger Cody
Webber 7B-9A 1,389 1,385 99.7 1,500 -111 58 40 69.0 NorhhwpRtprn
Webster: K-6 788 94 11.9 832 -44 37 9 24.3 Earhart Western
Western 9A-12A 2,241 827 36.9 1,950 291 98 25 25.5
White K-6 1,042 443 42.5 1,696 -654 41 13 31.7 Cleveland Osborn'Wilkins K-6 966 127 13.1 928 38 33 7 21.2 VonSteuben Osborn
Williams* K-6 886 881 99.4 51 28 54.9 Knudsen Northeastern
Wilson 7B-9A 1,123 24 2.1 1,180 -57 50 14 28.0 Southwestern
Wingert K-6 635 623 98.1 824 -189 26 16 61.5 Webber Northwestern
Winship K6; 7B-9A 1,103 775 70.3 1,125 -22 50 15 30.0 Cooley
Winterhalter PU 807 796 98.6 1,150 -343 39 29
• .
74.4 MacK-enzie
Woodward K-6 781 772 98.8 768 -13 30 17 56.7 McMichael Northwestern
Yost K-6 317 11 3.5 480 -163 16 2 12.5 Murphy Redford
■ ' . . M
- - - . ' • .
, . J , — -