Correspondence from Rankin to Wolfe Re Supplementary Information on Desegregation Clusters
Correspondence
April 3, 1972
5 pages
Cite this item
-
Case Files, Milliken Hardbacks. Correspondence from Rankin to Wolfe Re Supplementary Information on Desegregation Clusters, 1972. eb7666fa-52e9-ef11-a730-7c1e5247dfc0. LDF Archives, Thurgood Marshall Institute. https://ldfrecollection.org/archives/archives-search/archives-item/a7ccb0a3-8c21-445d-b6fd-9df79640a48a/correspondence-from-rankin-to-wolfe-re-supplementary-information-on-desegregation-clusters. Accessed July 07, 2026.
Copied!
#
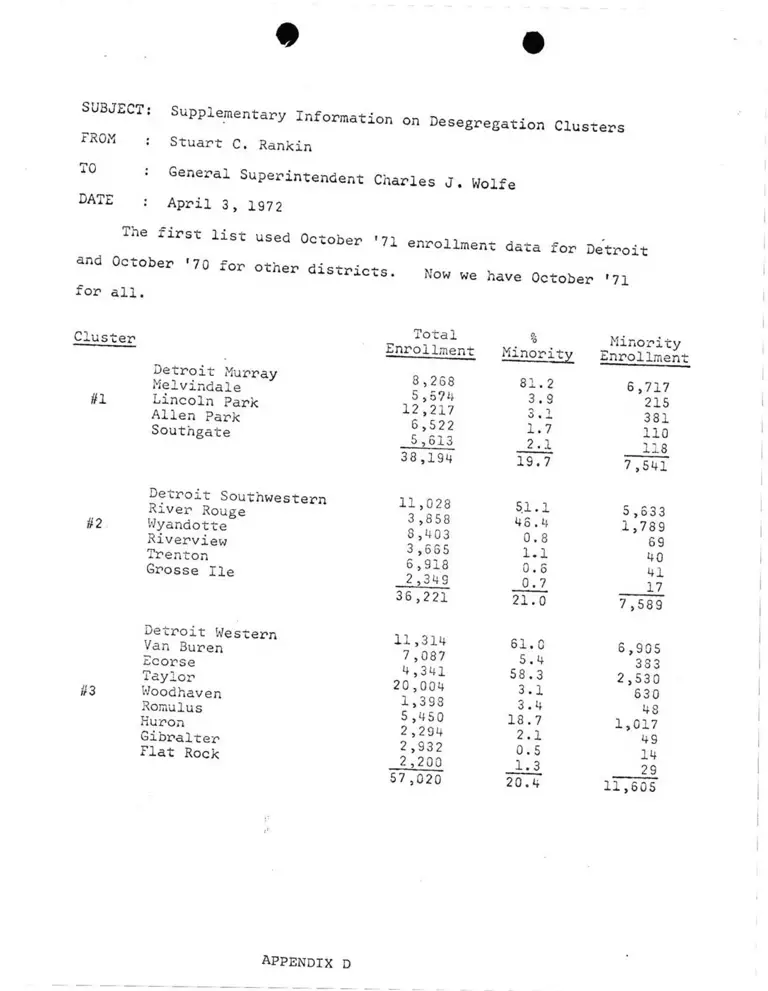
SUBJECT:
FROM :
TO ;
DATE ;
Supplementary Information on Desegregation Clusters
Stuart C. Rankin
General Superintendent Charles J. Wolfe
April 3 , 1 9 7 2
The first list used October *71
and October '70 for other districts,
for all.
enrollment data for Detroit
Now we have October '71
Detroit Murray
Melvindale
#1 Lincoln Park
Allen Park
Southgate
Detroit Southwestern River Rouge
#2 Wyandotte
Riverview
Trenton
Grosse H e
Detroit Western
Van Buren
Ecorse
Taylor
// 3 Woodhaven
Romulus
Huron
Gibralter
Flat Rock
Total %
enrollment Minori
8 , 2 6 8 8 1 . 2
5 , 5 7 4 3 .9
1 2 , 2 1 7 3 . 1
6 , 5 2 2 1 . 7
5 , 6 1 3 2 . 1
3 8 , 1 9 4 1 9 . 7
1 1 , 0 2 8 5 1 . 1
3 , 8 5 8 4 6 . 4
8 , 4 0 3 0 . 8
3 , 6 6 5 1 . 1
6 , 9 1 8 0 .6
2 , 3 4 3 0 . 7
3 6 , 2 2 1 2 1 . 0
1 1 , 3 1 4 6 1 . 0
7 , 0 8 7 5 . 4
4 , 3 4 1 5 8 . 3
2 0 , 0 0 4 3 . 1
1 , 3 3 3 3 .4
5 , 4 5 0 1 8 . 7
2 , 2 3 4 2 . 1
2 , 9 3 2 0 .5
2 , 2 0 0 1 . 3
5 7 , 0 2 0 2 0 o 4
-y
Minority
Enrollment
6 , 7 1 7
215
381
110
118
7 , 5 4 1
5 , 6 3 3
1 , 7 8 9
69
40
41
____17
7 , 5 8 9
6 , 9 0 5
3 S 3
2 , 5 3 0
630
48
1 , 0 1 7
49
14
____2_9
1 1 , 6 0 5
appendix D
#
- 2 -
Cluster
#4
#5
#6
# 7
Total % Minority
Enrollment Minority Enr oilmen'
Detroit Chadsey 5,975 42.8 2,560Westwood 5 ,120 36.9 1,887Inkster L ,624 8 5.9 ' 3,972Wayne 22,514- 1.3 289Cherry Hill 5 ,127 1.3 66
43,360 20.2 8 ,774
Detroit Northwestern 14,308 99.8 14,278Crestwood 5,282 0.7 39
Dearborn 21,634 1.2 2 5SDearborn Heights 5,626 2.3 132
Fairiane 1,188 0.1 1
Garden City 13,853 1.1 149
North Dearborn Hts. 2 ,765 1.0 28
64,656 23.0 14,883
Detroit Mackenzie 20,745 97.5 20,232
Detroit Cody 16,056 17.1 2 ,743
Northville 3 ,120 '0.5 15
Plymouth 9,300 0.6 S3
Livonia 38,105 0.8 298
Redford Union 9,677 0.4 41
South Redford 7,883 0.4 31
104,886 22.3 23,413
Detroit Central 12,746 99 . 8 12,725
Ferndale 8,376 10.6 885
Oak Park 5,867 10.3 607
Berkley 8 ,404 0.7 56
Southfield 16,346 0.8 125
51,739 27.8 14,398
#
- 3 -
Cluster Total
Enrollment
0,'O
Minority
Minority
Enrollment
#8
. Detroit Cooley
Detroit Redfora
Clarenceville
Farmington
Novi
19,200
15,534
3,918
16,339
1,712
56,703
82.8
5.5
0.7
0.7
1.1
29.8
15,896
851
- 26
113
19
16,905
£9
Detroit Mumford
Detroit Ford
Bloomfield Hills
West Bloomfield
Walled Lake
Avondale
12 ,115
10,705
9,438
4,772
10,303
• 3,906
51,239
95.4
31.7
1.0
0.8
1.1
1.0
29.7
11,560
3,398
93
36
110
41
15,238
n o
Detroit Northern
Highland Park
Hazel Park
Royal Oak
Birmingham
8 ,929
7 ,837
7,985
19,267
17,520
61,538
99.6
80.9
0.8
0.5
0 . 6
25.2
8 ,890
6,344
63
96
106
15,499
n i
Detroit Pershing
Hamtramck
Madison Heights
Lamphere
Clawson
Troy
14,672
3,044
4 ,708
5,875
4,996
5,953
39,248
68.9
31.9
1.4
1.0
0.4
0.2
28.6
10,109
972
65
6 0
18
14
11,23811,238
Cluster
#12
#13
#14
#15
#16
Total % MinorityEnrollment Minority Enrollmen
Pontiac 24,478 3 5.5 8 , 6 9 SHolly 3 ,413 3.1 105Brandon 1,813 0.9 1 £Waterford 18 ,317 1.3 2M-2Lake Orion 5,378 1.0 5 3Oxford 2,817 0.5Rochester 8,378 0.3 2 6Clarkston 6,485 0.9 59Huron Valley 6,949 0 . 5 3 4South Lyon 3 ,152 1.3 42
81.160 11.4 9,290
Detroit Kettering 17,966 93.5 16,797Utica 20,073 0.5 108Warren 29,995 0.9 283
68,034 25.3 17 ,188
Detroit Northeastern 10,286 89. 2 9,177Detroit Osborn 11,962 23.5 2,806Van Dyke 7 ,192 1.2 86Warren Woods 8,958 0.4 37Centerline 6,865 1.2 80Fitzgerald 5,374 0.8 4 4
50,637 24.2 12,230
Detroit King 9,802 97.1 9,520Grosse Pointe 13,323 0.3 37Harper Woods 1,981 0 . 3 0East Detroit 12,831 1.1 142
37,937 25.6 9,705
Detroit Southeastern 15,418 82.9 12,782Lake Shore 9,621 0.9 82Lakeview 7,7 51 0.4 31Roseville 14 ,734 2.4 347South Lake 5,306 0 . 6 30
52,830 25.1 13,272
5
Cluster Total %
Enrollment Minority
Minority
Enrollment
Detroit Finney
Detroit Denby
#17 Chippewa Valley
Fraser
Clintondale
1 5 , 0 9 3 57 . 2 8 , 6 3 3
1 0 , 9 0 6 5 . 8 633
2 , 7 8 9 0 . 6 - 17
7 , 304 0 . 5 34
4 , 9 9 8 8 . 9 447
4 1 , 0 9 0 23 . 8 9 , 7 6 4
Mt. Clemens
Anchor Bay
Richmond
Romeo
#18 L'Anse Creuse
Armada
New Haven
6 , 9 0 1 2 2 . 2 1 , 5 3 0
2 , 6 9 9 co o 81
1 , 8 5 0 0 . 5 9
3 , 7 9 8 2 . 6 100
7 , 6 3 5 1 . 2 94
1 , 5 0 0 2 . 1 32
1 , 7 5 2 2 2 . 3 331
2 6 , 1 3 5 8 . 6 2 , 2 3 7