Tables on Race and Gender Representation in the North Carolina Executive Branch
Working File
June 30, 1982
Cite this item
-
Case Files, Thornburg v. Gingles Working Files - Guinier. Tables on Race and Gender Representation in the North Carolina Executive Branch, 1982. df7c9912-df92-ee11-be37-6045bdeb8873. LDF Archives, Thurgood Marshall Institute. https://ldfrecollection.org/archives/archives-search/archives-item/ab738f53-df32-4f15-8d31-34128e392ec3/tables-on-race-and-gender-representation-in-the-north-carolina-executive-branch. Accessed July 08, 2026.
Copied!
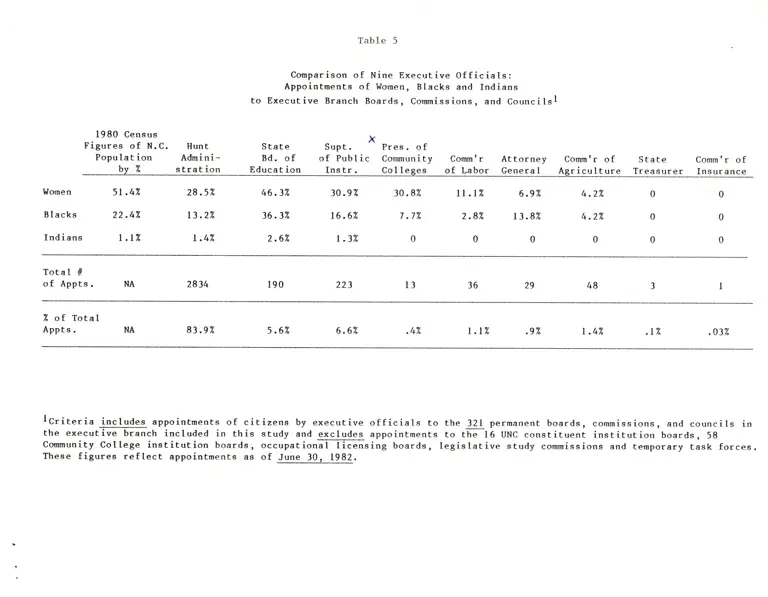
    Table 5

Comparison of Nine Executive Officials:
Appointments of Women, Blacks and Indians

to Executive Branch Boards, Commissions, and Councils1

1980 Census


X
Figures of N.C. Hunt State Supt. Pres. of
Population Admini— Bd. of of Public Community Comm'r Attorney Comm'r of State Comm'r of
by Z stration Education Instr. Colleges of Labor General Agriculture Treasurer Insurance

Women 51.4% 28.5% 46.3% 30.9% 30.8% 11.12 6.9% 4.2% 0 0
Blacks 22.4% 13.2% 36.3% 16.62 7.7% 2.8% 13.8% 4.2% 0 0
Indians 1.12 1.4% 2.6% 1.3% 0 0 0 0 0 0
Total #
of Appts. NA 2834 190 223 13 36 29 48 3 1
Z of Total
Appts. NA 83.9% 5.6% 6.6% .4Z 1.1% .9Z 1.4% .12 .032


lCriteria includes appointments of citizens by executive officials to the 321 permanent boards, commissions, and councils in
the executive branch included in this study and excludes appointments to the 16 UNC constituent institution boards, 58
Community College institution boards, occupational licensing boards, legislative study commissions and temporary task forces.
These figures reflect appointments as of June 30, 1982.


Table 6

Comparison of Governor Hunt and former Governor Holshouser:
Appointments of Women, Blacks and Indians
to Executive Branch Boards, Commissions, and Councils


Governor Governor
Holshouser Hunt
(as of 1/8/77) (as of 6/30/82)

Women 22.0% 29.9%
Blacks 6.2% 13.3%
Indians 1.3% 2.2%
Total #
of Appts. 966 1290


Criteria: Figures reflect appointments to 136 boards,
commissions, and councils that

l) existed during the Holshouser Administration
2) continue to exist today, and
3) are part of the 321 groups identified in this study

Number

No Blacks

108

of Boards,

Table 7

Commissions,

and Councils

in the Executive Branch
on Which There Are:

No Women

63

No Indians

282